User:AnonymousFish/Sandbox
Introduction to fractals
[edit]
The term fractal usually refers to a geometric shape in which the overall shape can be decomposed into sections or parts, each of which are (at least approximately) smaller copies of the original shape.
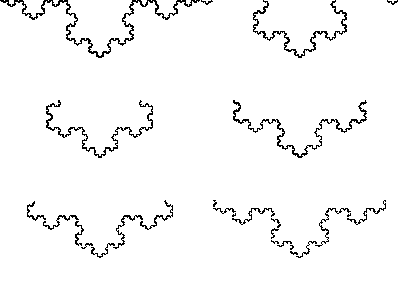
Figure 1a shows a fractal known as the Koch curve. Figure 1b shows that the Koch curve can be created by iterating a simple pattern. Starting with a line segment, we replace the central third of the line with an equalateral triangle and then remove the base of the triangle. This simple procedure is then repeated for each new set of line segments created. Each iteration produces a more detailed curve and in the limit we reach the Koch curve.
Figure 1c shows that if we zoom in to any part of the Koch curve we would see the same pattern no matter what scale we zoomed in to. This is an important property of fractals known as scale invariance or self-similarity.
There are several key features which make fractals interesting in both theory and practise.
- Scale invariance. If we zoom in on the fractal the same pattern can found at different scales. The pattern is said to be scale invariant.
- Roughness. Unlike most conventional geometry, fractals remain non-smooth no matter what scale they are observed.
- Simplicity. Fractals are very simple to understand and construct, but they allow us to replicate and decompose many seemingly complex structures and phenomena that are commonly observed in Nature
Mathematical definition
[edit]Fractals are usually defined as any set in which the fractal dimension is strictly greater than the topological dimension. Topological dimensions are just normal Euclidean dimensions where . If we imagine an evenly spaced grid of squares, the fractal dimension[nb 1] is defined as
where is the number of boxes of side length needed to cover the whole structure. We can see in figure 2 how the fractal dimension of the Koch curve can be calculated using this definition. This basic method can be used to measure the fractal dimension of naturally observable fractals.
Normal lines or curves that are specified by Euclidean geometry always have a fractal (and Euclidean) dimension of 1; rectangles and circles have fractal dimension of 2. The Koch curve has a fractal dimension of 1.261 (which can be calculated analytically). The intuition behind this is that fractals are more complex than regular lines and curves and therefore occupy a space that is larger than 1 dimensional space of regular lines, but less than the two dimensional space of rectangles or other 2-dimensional Euclidean shapes.
When we talk about complexity we are actually referring to the amount by which the fractal deviates from a smooth line when we zoom in to an infinitesimal section. Normal Euclidean lines and curves will always become smooth when we observe an infinitesimal section, whereas fractals will always exhibit some degree of roughness. The rougher the fractal is at the infinitesimal scale, the larger the fractal dimension.
Types of fractal
[edit]We introduced the discussion on fractals talking about geometric fractal shapes which are exactly self-similar. However, there are two other types of fractal which have slightly different levels of self-similarity.
- Exact self-similarity. Exactly self-similar
- Quasi self-similarity. Shapes that exhibit . Smaller replicas of the original shape can be observed at different frequencies
- Statistical self-similarity. These fractals are random geometry or processes which possess statistical self-similarity. That means that the probability of various events occurring exhibits self-similarity.
Of these three types of fractals it is the last type which is the most interesting from an applied point of view. Random fractals processes can be used to represent and understand many of the seemingly complex patterns and systems found in nature. Examples include lightning, material fractures, rivers, mountain ranges and coast lines. They can also be used in the study of financial asset prices.
Fractals in finance
[edit]When we talk about a statistical self-similar process it is useful to define them in the following way: A random process that satisfies
for some and all, is said to be self-similar. The number is the self-similarity index, or scaling exponent of the process . is also known as the Hurst exponent and is closely linked to the fractal dimension , such that . There are three main examples self-similar stochastic processes that have been used to model financial assets.
- Brownian motion
- Levy-stable process
- Fractional Brownian motion
Empirical evidence suggests that many financial time series are not self-similar, but instead have thinner tails and become less peaked in the bells when the sampling interval increases. The growing multifractal literature has been developed to address the shortcomings of these self-similar models.
Notes
[edit]- ^ There are several variations regarding how exactly to define the fractal dimension. Often the Haussdorf dimension is used. In most cases the definition provided is sufficient


