Talk:Orthographic map projection
| This article is rated Start-class on Wikipedia's content assessment scale. It is of interest to the following WikiProjects: | ||||||||||||||
| ||||||||||||||
Removing the C++ example
[edit]Would there be any objections to scrapping the C++ section? It's a bit off topic, and makes sense to <1% of the audience (myself included, and I understand code and GIS). I thought I'd add it here before doing it myself.+mwtoews 05:53, 11 January 2007 (UTC)
- Okay, I've removed the example. Here it is for the very few who would care:
  The following [[source code]] fragment demonstrates this algorithm in [[C++]]:

 // Loop through rows and columns of output image f_xy
 // obtaining longitude and latitude at each (x, y) point.
 for (i = 0; i < rows; ++i)
 {
     for (j = 0; j < cols; ++j)
     {
         // Here, (LON, LAT) is a grid of longitudes
         // and latitudes defined at each (x[i], y[j])
         // in the projection plane.  Determined using
         // the inverse orthographic projection.
         lon_pt = LON(i, j);
         lat_pt = LAT(i, j);
         //
         // Interpolate inside image(LON, LAT)
         bool in_domain = DOM(i, j);
         if (in_domain)
         {
             //////////////////////////////
             // Longitudinal periodicity //
             //////////////////////////////
             double test_lon_pt = lon_pt;
             while (test_lon_pt > lon_max)
                 test_lon_pt -= 2*pi;
             while (test_lon_pt < lon_min)
                 test_lon_pt += 2*pi;
             // In case of while loop overshoot
             if (test_lon_pt > lon_max)
                 test_lon_pt = lon_max;
             if (test_lon_pt < lon_min)
                 test_lon_pt = lon_min;
             lon_pt = test_lon_pt;
             //
             // Pole points might not be defined, so just go to the
             // highest +/- latitutude values available.
             if (lat_pt > lat_max)
                 lat_pt = lat_max;
             if (lat_pt < lat_min)
                 lat_pt = lat_min;
             //
             // Invoke, for example, bilinear interpolation to obtain f(x,y)
             f_xy_pt = bilinear(image, lat, lon, image_rows, image_cols, lat_pt, lon_pt);
             f_xy(i, j) = f_xy_pt;
         }
     }
 }
Replace low-contrast images
[edit]
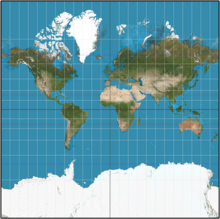
I will be replacing images on the various map projection pages. Presently many are on a satellite composite image from NASA that, while realistic, poorly demonstrates the projections because of dark color and low contrast. I have created a stylization of the same data with much brighter water areas and a light graticule to contrast. See the thumbnail of the example from another article. Some images on some pages are acceptable but differ stylistically from most articles; I will replace these also.
The images will be high resolution and antialiased, with 15° graticules for world projections, red, translucent equator, red tropics, and blue polar circles.
Please discuss agreement or objections over here (not this page). I intend to start these replacements on 13 August. Thank you. Strebe (talk) 22:45, 6 August 2011 (UTC)
The current image does not demonstrate the projection well. It may be that the projection is centered on the equator that ruins it for me. See for example: http://en.wiki.x.io/wiki/File:Location_North_America.svg which looks more 3d to me. The picture here feels really "flat", but the reason I like the Orthographic projection is due to its accurate representation of a 3d world (although is obvious drawback is that you only see half the earth). — Preceding unsigned comment added by 199.46.198.232 (talk) 14:42, 14 December 2012 (UTC)
- A fair point, but I suspect the effect has more to do with the coloring contrast than the particular spot above the earth. Since I’m familiar with the equatorial presentation, to me it looks quite “3D” as it is. The equator/prime meridian were chosen as center to be as “neutral” as possible and to match with the images in other projection articles. Strebe (talk) 21:09, 14 December 2012 (UTC)
Merger discussion that effects this page
[edit]Talk:Aerial_photography#Merger_with_Orthophotomap — Preceding unsigned comment added by Da5nsy (talk • contribs) 00:01, 8 January 2013 (UTC)
Hello! This is a note to let the editors of this article know that File:Orthographic projection SW.jpg will be appearing as picture of the day on June 4, 2014. You can view and edit the POTD blurb at Template:POTD/2014-06-04. If this article needs any attention or maintenance, it would be preferable if that could be done before its appearance on the Main Page. Thanks! — Crisco 1492 (talk) 01:52, 19 May 2014 (UTC)


