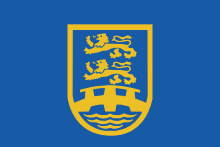
Schleswig Party
Schleswig Party Slesvigsk Parti | |
|---|---|
 | |
| German name | Schleswigsche Partei |
| Chairperson | Rainer Naaujeck |
| Founded | 1920 |
| Headquarters | Vestergade 30 6200 Aabenraa |
| Ideology | Regionalism German minority interests |
| Political position | Centre |
| European affiliation | European Free Alliance |
| Colours | Yellow |
| Regions | 0 / 205 |
| Municipal councils | 10 / 2,436 |
| Mayors | 1 / 98 |
| Election symbol | |
| S | |
| Website | |
| www.slesvigsk-parti.dk | |
 |
|---|


The Schleswig Party (Danish: Slesvigsk Parti, German: Schleswigsche Partei) is a regional political party in Denmark representing the North Schleswig Germans and the Danish minority of Southern Schleswig.


History
[edit]The party was established in August 1920 as the Schleswig Voters Club (German: Schleswigscher Wählerverein) following the Schleswig Plebiscites and the ceding of Northern Schleswig from Germany to Denmark.[1] It ran in the September 1920 Folketing elections, winning a single seat taken by Johannes Schmidt-Wodder.[1] The party maintained its single seat in elections in 1924, 1926, 1929, 1932, 1935 and 1939.[2][3]
The party did not run in the 1943 or 1945 elections, but returned to contest the 1947 elections,[4] in which it failed to win a seat.[2] The party remained seatless until the September 1953 elections, retaining its seat in 1957 and 1960. The 1964 elections saw the party lose its single seat, and it did not contest the 1966 elections.
The party returned to run in the 1968 elections, but failed to win a seat. After failing to win a seat in the 1971 elections, the party has not contested any further national elections, although it continues to participate in local politics in North Schleswig.
Between 1973 and 1979 the party was represented in Parliament by Jes Schmidt, a candidate elected through an electoral agreement with the Centre Democrats. After his death in 1979, the agreement between the two parties stopped because the SP proposed a candidate with a Waffen-SS past, thus unacceptable for the CD.[5]
Leaders
[edit]- Johannes Schmidt-Wodder (1920–35)
- Hans Christian Jepsen (1983–91)
- Peter Bieling (1991–99)
- Gerhard Mammen (1999–2010)
- Marit Jessen Rüdiger (2010–12)
- Carsten Leth Schmidt (2012–2022)
- Rainer Naujeck (2022–)[6]
Election results
[edit]Folketing
[edit]| Election | Votes | % | +/– | Seats | +/– | |
|---|---|---|---|---|---|---|
| 1920 (Sep) | 7,505 | 0.6% | New | 1 / 149
|
New | |
| 1924 | 7,715 | 0.6% | 0.0 | 1 / 149
|
||
| 1926 | 10,422 | 0.8% | +0.2 | 1 / 149
|
||
| 1929 | 9,787 | 0.7% | –0.1 | 1 / 149
|
||
| 1932 | 9,868 | 0.6% | –0.1 | 1 / 149
|
||
| 1935 | 12,617 | 0.8% | +0.2 | 1 / 149
|
||
| 1939 | 15,016 | 0.9% | +0.1 | 1 / 149
|
||
| 1943–1945 | Did not run | |||||
| 1947 | 7,464 | 0.4% | +0.4 | 0 / 150
|
||
| 1950 | 6,406 | 0.3% | –0.1 | 0 / 151
|
||
| 1953 (Apr) | 8,438 | 0.4% | +0.1 | 0 / 151
|
||
| 1953 (Sep) | 9,721 | 0.5% | +0.1 | 1 / 179
|
||
| 1957 | 9,202 | 0.4% | –0.1 | 1 / 179
|
||
| 1960 | 9,058 | 0.4% | 0.0 | 1 / 179
|
||
| 1964 | 9,274 | 0.4% | 0.0 | 0 / 179
|
||
| 1966 | Did not run | |||||
| 1968 | 6,831 | 0.2% | +0.2 | 0 / 179
|
||
| 1971 | 6,743 | 0.2% | 0.0 | 0 / 179
|
||
| 1973– | Did not run | |||||
Landsting
[edit]| Election | Votes | Seats | ||||
|---|---|---|---|---|---|---|
| 1928 | 6,736 | 0 / 76
| ||||
| 1932 | Did not run | |||||
| 1936 | 8,868 | 0 / 76
| ||||
| 1939 | 11,122 | 0 / 76
| ||||
| 1943–1953 | Did not run | |||||
Local elections
[edit]
|
|
| ||||||||||||||||||||||||||||||||||||||||||||||||||||||||||||||||||||||||||||||||||||||||||||||||||||||||||||||||||||||||||||||||||||||||||||||||||||||||||||||||||||||||||||||||||||||||||
See also
[edit]- April 1920 Danish Folketing election
- Danish Party
- July 1920 Danish Folketing election
- September 1920 Danish Folketing election
- South Schleswig Voters' Association
- 1920 Schleswig plebiscites
References
[edit]- ^ a b The Schleswig Party after 1920 Schleswig Party (in German)
- ^ a b Nohlen, D & Stöver, P (2010) Elections in Europe: A data handbook, pp552–553 ISBN 978-3-8329-5609-7
- ^ Cohn, Einar (May 1939). "Rigsdagsvalgene og Folkeafstemningen i April og Maj 1939". Danmarks Statistik.
- ^ Nohlen & Stöver, p540
- ^ Hans Schultz Hansen,Sønderjyllands historie siden 1945
- ^ "Slesvigsk Parti". Folkevalgte.dk. 3 January 2022. Retrieved 3 February 2023.
