Sapang Dalaga
Sapang Dalaga | |
|---|---|
| Municipality of Sapang Dalaga | |
| Etymology: Maiden in a creek | |
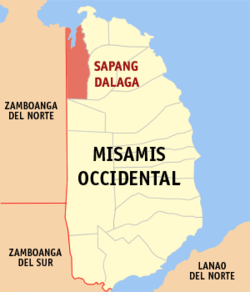
 Map of Misamis Occidental with Sapang Dalaga highlighted | |
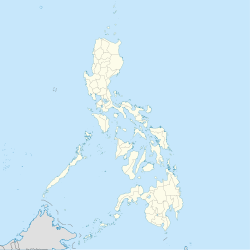
Location within the Philippines | |
| Coordinates: 8°33′N 123°34′E / 8.55°N 123.57°E | |
| Country | Philippines |
| Region | Northern Mindanao |
| Province | Misamis Occidental |
| District | 1st district |
| Founded | August 12, 1957 |
| Barangays | 28 (see Barangays) |
| Government | |
| • Type | Sangguniang Bayan |
| • Mayor | Donjie D. Animas (NP) |
| • Vice Mayor | Manuel G. Animas (NP) |
| • Representative | Jason P. Almonte (PDPLBN) |
| • Municipal Council | Members |
| • Electorate | 16,252 voters (2022) |
| Area | |
• Total | 93.93 km2 (36.27 sq mi) |
| Elevation | 109 m (358 ft) |
| Highest elevation | 448 m (1,470 ft) |
| Lowest elevation | 0 m (0 ft) |
| Population (2020 census)[3] | |
• Total | 20,490 |
| • Density | 220/km2 (560/sq mi) |
| • Households | 5,156 |
| Economy | |
| • Income class | 4th municipal income class |
| • Poverty incidence | 37.23 |
| • Revenue | ₱ 96.02 million (2020), 41.15 million (2012), 47.15 million (2013), 52.91 million (2014), 60.85 million (2015), 64.83 million (2016), 71.92 million (2017), 76.86 million (2018), 85.07 million (2019), 108.6 million (2021), 141.7 million (2022) |
| • Assets | ₱ 361.6 million (2020), 108.9 million (2012), 117.7 million (2013), 121.3 million (2014), 82.11 million (2015), 106.1 million (2016), 227.8 million (2017), 255.7 million (2018), 281.4 million (2019), 377.3 million (2021), 400.9 million (2022) |
| • Expenditure | ₱ 73.51 million (2020), 40.84 million (2012), 47.23 million (2013), 46.1 million (2014), 47.31 million (2015), 50.74 million (2016), 52.73 million (2017), 54.39 million (2018), 65.12 million (2019), 91.75 million (2021), 114.9 million (2022) |
| • Liabilities | ₱ 154.6 million (2020), 32.08 million (2012), 39.73 million (2013), 31.31 million (2014), 47.41 million (2015), 60.21 million (2016), 98.16 million (2017), 103.6 million (2018), 129.7 million (2019), 112 million (2021), 129.7 million (2022) |
| Service provider | |
| • Electricity | Misamis Occidental 1 Electric Cooperative (MOELCI 1) |
| Time zone | UTC+8 (PST) |
| ZIP code | 7212 |
| PSGC | |
| IDD : area code | +63 (0)88 |
| Native languages | Subanon Cebuano Tagalog |
| Website | www |
Sapang Dalaga, officially the Municipality of Sapang Dalaga (Cebuano: Lungsod sa Sapang Dalaga; Tagalog: Bayan ng Sapang Dalaga), is a municipality in the province of Misamis Occidental, Philippines. According to the 2020 census, it has a population of 20,490 people.[3]
It is located 96 kilometres (60 mi) from Ozamiz City and 50 kilometres (31 mi) from Dipolog Airport.
It is rich in mineral resources such as gold, copper and manganese, and has mountains, rivers, waterfalls and beaches. Baga (meaning "waterfalls" in the native language) is one kilometer from the town center and can be reached by foot or motor vehicles. Mountains, such as Mount Dasa and Mount Pedoluan, are also nearby. Casul Bay, which connects to Murcielagos Bay, can be navigated.
Etymology
[edit]Its name is derived from the phrase sapa ng dalaga (ancient Visayan language dating back to the 14th century before Spanish colonization), meaning "maiden in a creek".
The names of some barangays were derived from rivers and trees, for example, Guinabot came from a river, Locus was derived from the native locus tree.
Geography
[edit]Barangays
[edit]Sapang Dalaga is politically subdivided into 28 barangays. Each barangay consists of puroks while some have sitios.
- Bautista
- Bitibut
- Boundary
- Caluya
- Capundag
- Casul
- Dalumpinas
- Dasa
- Dioyo
- Disoy
- El Paraiso
- Guinabot
- Libertad
- Locus
- Macabibo
- Manla
- Masubong
- Medallo
- Agapito Yap Sr. (Napilan)
- Poblacion
- Salimpuno
- San Agustin
- Sapang Ama
- Sinaad
- Sipac
- Sixto Velez Sr.
- Upper Bautista
- Ventura
Climate
[edit]| Climate data for Panaon, Misamis Occidental | |||||||||||||
|---|---|---|---|---|---|---|---|---|---|---|---|---|---|
| Month | Jan | Feb | Mar | Apr | May | Jun | Jul | Aug | Sep | Oct | Nov | Dec | Year |
| Mean daily maximum °C (°F) | 27 (81) |
27 (81) |
29 (84) |
30 (86) |
30 (86) |
29 (84) |
29 (84) |
29 (84) |
30 (86) |
29 (84) |
29 (84) |
28 (82) |
29 (84) |
| Mean daily minimum °C (°F) | 22 (72) |
22 (72) |
22 (72) |
23 (73) |
24 (75) |
24 (75) |
23 (73) |
23 (73) |
23 (73) |
23 (73) |
23 (73) |
22 (72) |
23 (73) |
| Average precipitation mm (inches) | 69 (2.7) |
44 (1.7) |
37 (1.5) |
29 (1.1) |
87 (3.4) |
137 (5.4) |
131 (5.2) |
141 (5.6) |
143 (5.6) |
134 (5.3) |
68 (2.7) |
53 (2.1) |
1,073 (42.3) |
| Average rainy days | 9.9 | 7.6 | 7.4 | 8.1 | 21.6 | 26.5 | 26.4 | 26.6 | 25.8 | 24.3 | 15.1 | 10.4 | 209.7 |
| Source: Meteoblue[5] | |||||||||||||
Demographics
[edit]
|
| |||||||||||||||||||||||||||||||||||||||
| Source: Philippine Statistics Authority[6][7][8][9] | ||||||||||||||||||||||||||||||||||||||||
In the 2020 census, the population of Sapang Dalaga was 20,490 people,[3] with a density of 220 inhabitants per square kilometre or 570 inhabitants per square mile.
Economy
[edit]Poverty incidence of Sapang Dalaga
10
20
30
40
50
60
2006
51.70 2009
43.85 2012
46.60 2015
41.41 2018
35.35 2021
37.23 Source: Philippine Statistics Authority[10][11][12][13][14][15][16][17] |
Its economy is based on agriculture, with root crops such as gabi, palaw, sweet potato, ube and apale. It has plantation of coconuts, lanzones, mangosteen, rambotan, marang, hibi (June plume), guyabano, santol, durian and native bananas. Herbal plants such as Salingkapao (tawa-tawa), buyo, dalapot (sambong) grows in each household plot. Vegetables such as string beans, squash, malunggay, likway, bago and sikwa can be found. Sea foods such as bongcawel, saang, bacase, king crabs, nukos (squid), lato (seaweeds), kitong, dangget, lapu-lapu, pasayan (prawn) can be bought every Friday (market day).
References
[edit]- ^ Municipality of Sapang Dalaga | (DILG)
- ^ "2015 Census of Population, Report No. 3 – Population, Land Area, and Population Density" (PDF). Philippine Statistics Authority. Quezon City, Philippines. August 2016. ISSN 0117-1453. Archived (PDF) from the original on May 25, 2021. Retrieved July 16, 2021.
- ^ a b c Census of Population (2020). "Region X (Northern Mindanao)". Total Population by Province, City, Municipality and Barangay. Philippine Statistics Authority. Retrieved 8 July 2021.
- ^ "PSA Releases the 2021 City and Municipal Level Poverty Estimates". Philippine Statistics Authority. 2 April 2024. Retrieved 28 April 2024.
- ^ "Sapang Dalaga: Average Temperatures and Rainfall". Meteoblue. Retrieved 29 April 2020.
- ^ Census of Population (2015). "Region X (Northern Mindanao)". Total Population by Province, City, Municipality and Barangay. Philippine Statistics Authority. Retrieved 20 June 2016.
- ^ Census of Population and Housing (2010). "Region X (Northern Mindanao)" (PDF). Total Population by Province, City, Municipality and Barangay. National Statistics Office. Retrieved 29 June 2016.
- ^ Censuses of Population (1903–2007). "Region X (Northern Mindanao)". Table 1. Population Enumerated in Various Censuses by Province/Highly Urbanized City: 1903 to 2007. National Statistics Office.
- ^ "Province of Misamis Occidental". Municipality Population Data. Local Water Utilities Administration Research Division. Retrieved 17 December 2016.
- ^ "Poverty incidence (PI):". Philippine Statistics Authority. Retrieved December 28, 2020.
- ^ "Estimation of Local Poverty in the Philippines" (PDF). Philippine Statistics Authority. 29 November 2005.
- ^ "2003 City and Municipal Level Poverty Estimates" (PDF). Philippine Statistics Authority. 23 March 2009.
- ^ "City and Municipal Level Poverty Estimates; 2006 and 2009" (PDF). Philippine Statistics Authority. 3 August 2012.
- ^ "2012 Municipal and City Level Poverty Estimates" (PDF). Philippine Statistics Authority. 31 May 2016.
- ^ "Municipal and City Level Small Area Poverty Estimates; 2009, 2012 and 2015". Philippine Statistics Authority. 10 July 2019.
- ^ "PSA Releases the 2018 Municipal and City Level Poverty Estimates". Philippine Statistics Authority. 15 December 2021. Retrieved 22 January 2022.
- ^ "PSA Releases the 2021 City and Municipal Level Poverty Estimates". Philippine Statistics Authority. 2 April 2024. Retrieved 28 April 2024.


