Huade County
Huade County
化德县 • ᠬᠤᠸᠠᠳᠧ ᠰᠢᠶᠠᠨ | |
|---|---|
| Coordinates: 41°54′N 114°01′E / 41.900°N 114.017°E | |
| Country | China |
| Autonomous region | Inner Mongolia |
| Prefecture-level city | Ulaan Chab |
| County seat | Changshun |
| Area | |
• Total | 2,520 km2 (970 sq mi) |
| Elevation | 1,464 m (4,803 ft) |
| Population (2020)[1] | |
• Total | 95,273 |
| • Density | 38/km2 (98/sq mi) |
| Time zone | UTC+8 (China Standard) |
| Website | www |
| Huade County | |||||||
|---|---|---|---|---|---|---|---|
| Chinese name | |||||||
| Simplified Chinese | 化德县 | ||||||
| Traditional Chinese | 化德縣 | ||||||
| |||||||
| Mongolian name | |||||||
| Mongolian Cyrillic | Хуате шиан | ||||||
| Mongolian script | ᠬᠤᠸᠠᠳᠧ ᠰᠢᠶᠠᠨ | ||||||
| |||||||
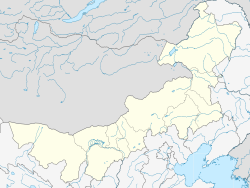
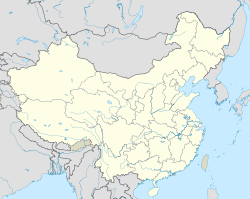
Huade (Mongolian: ᠬᠤᠸᠠᠳᠧ ᠰᠢᠶᠠᠨ; Chinese: 化德县) is a county of central Inner Mongolia, China, bordering Hebei province to the southeast, Xilin Gol League to the northeast, and Shangdu County to the west. It is under the administration of Ulaan Chab city.
Administrative divisions
[edit]Huade County is made up of 3 towns and 3 townships.
| Name | Simplified Chinese | Hanyu Pinyin | Mongolian (Hudum Script) | Mongolian (Cyrillic) | Administrative division code |
|---|---|---|---|---|---|
| Towns | |||||
| Changshun Town | 长顺镇 | Chángshùn Zhèn | ᠴᠠᠩ ᠱᠦᠨ ᠪᠠᠯᠭᠠᠰᠤ | Цан шөн балгас | 150922103 |
| Chaoyang Town | 朝阳镇 | Cháoyáng Zhèn | ᠴᠣᠤ ᠶᠠᠩ ᠪᠠᠯᠭᠠᠰᠤ | Цуу ян балгас | 150922104 |
| Qihao Town | 七号镇 | Qīhào Zhèn | ᠴᠢ ᠬᠣᠤ ᠪᠠᠯᠭᠠᠰᠤ | Чи хоо балгас | 150922105 |
| Townships | |||||
| Dabat Township | 德包图乡 | Débāotú Xiāng | ᠳᠠᠪᠠᠭᠠᠲᠤ ᠰᠢᠶᠠᠩ | Даваат шиян | 150922200 |
| Gun Hudag Township | 公腊胡洞乡 | Gōnglàhúdòng Xiāng | ᠭᠦᠨᠬᠤᠳᠳᠤᠭ ᠰᠢᠶᠠᠩ | Хнхудаг шиян | 150922201 |
| Bayan Tal Township | 白音特拉乡 | Báiyīntèlā Xiāng | ᠪᠠᠶᠠᠨᠲᠠᠯᠠ ᠰᠢᠶᠠᠩ | Баянтөл шиян | 150922202 |
Other: Changshun Industrial Park, Huade County (化德县长顺工业园区)
Climate
[edit]Huade has a monsoon-influenced, continental semi-arid climate (Köppen BSk), with very cold and dry winters, hot, somewhat humid summers, and strong winds, especially in spring. The monthly 24-hour average temperature ranges from −15.1 °C (4.8 °F) in January to 19.5 °C (67.1 °F) in July, with the annual mean at 3.23 °C (37.8 °F). The annual precipitation is 313 millimetres (12.3 in), with more than half of it falling in July and August alone. With monthly percent possible sunshine ranging from 60% in July to 75% in January and October, sunshine is abundant year-round, and there are 3,077 hours of bright sunshine annually.
| Climate data for Huade County, elevation 1,483 m (4,865 ft), (1991–2020 normals) | |||||||||||||
|---|---|---|---|---|---|---|---|---|---|---|---|---|---|
| Month | Jan | Feb | Mar | Apr | May | Jun | Jul | Aug | Sep | Oct | Nov | Dec | Year |
| Record high °C (°F) | 6.9 (44.4) |
13.4 (56.1) |
20.1 (68.2) |
29.4 (84.9) |
31.9 (89.4) |
36.4 (97.5) |
36.5 (97.7) |
32.9 (91.2) |
31.9 (89.4) |
23.7 (74.7) |
16.8 (62.2) |
10.8 (51.4) |
36.5 (97.7) |
| Mean daily maximum °C (°F) | −8.7 (16.3) |
−4.0 (24.8) |
3.5 (38.3) |
12.1 (53.8) |
19.0 (66.2) |
23.7 (74.7) |
25.8 (78.4) |
24.3 (75.7) |
19.0 (66.2) |
10.7 (51.3) |
0.8 (33.4) |
−7.0 (19.4) |
9.9 (49.9) |
| Daily mean °C (°F) | −14.7 (5.5) |
−10.6 (12.9) |
−3.2 (26.2) |
5.3 (41.5) |
12.5 (54.5) |
17.4 (63.3) |
19.8 (67.6) |
18.2 (64.8) |
12.5 (54.5) |
4.2 (39.6) |
−5.3 (22.5) |
−12.7 (9.1) |
3.6 (38.5) |
| Mean daily minimum °C (°F) | −19.1 (−2.4) |
−15.6 (3.9) |
−8.7 (16.3) |
−0.7 (30.7) |
6.1 (43.0) |
11.5 (52.7) |
14.5 (58.1) |
12.8 (55.0) |
6.9 (44.4) |
−0.9 (30.4) |
−9.9 (14.2) |
−17.0 (1.4) |
−1.7 (29.0) |
| Record low °C (°F) | −31.5 (−24.7) |
−30.9 (−23.6) |
−25.8 (−14.4) |
−14.4 (6.1) |
−9.7 (14.5) |
−1.5 (29.3) |
5.6 (42.1) |
4.2 (39.6) |
−6.8 (19.8) |
−15.7 (3.7) |
−27.3 (−17.1) |
−30.9 (−23.6) |
−31.5 (−24.7) |
| Average precipitation mm (inches) | 1.4 (0.06) |
2.5 (0.10) |
4.8 (0.19) |
13.5 (0.53) |
32.0 (1.26) |
54.4 (2.14) |
93.3 (3.67) |
59.1 (2.33) |
37.3 (1.47) |
18.0 (0.71) |
6.2 (0.24) |
1.8 (0.07) |
324.3 (12.77) |
| Average precipitation days (≥ 0.1 mm) | 2.7 | 3.2 | 4.3 | 5.2 | 7.9 | 11.9 | 13.4 | 10.9 | 9.3 | 5.8 | 4.3 | 3.1 | 82 |
| Average snowy days | 5.9 | 6.7 | 6.6 | 4.5 | 0.9 | 0 | 0 | 0 | 0.5 | 3.5 | 7.2 | 7.9 | 43.7 |
| Average relative humidity (%) | 66 | 58 | 47 | 40 | 41 | 52 | 63 | 62 | 56 | 54 | 60 | 65 | 55 |
| Mean monthly sunshine hours | 213.0 | 214.3 | 256.2 | 260.3 | 284.9 | 266.3 | 270.7 | 267.4 | 240.1 | 241.5 | 205.0 | 196.7 | 2,916.4 |
| Percent possible sunshine | 72 | 71 | 69 | 65 | 63 | 59 | 59 | 63 | 65 | 71 | 71 | 70 | 67 |
| Source: China Meteorological Administration[2][3][4] | |||||||||||||
References
[edit]- www.xzqh.org (in Chinese)
- ^ Inner Mongolia: Prefectures, Cities, Districts and Counties
- ^ 中国气象数据网 – WeatherBk Data (in Simplified Chinese). China Meteorological Administration. Retrieved 10 October 2023.
- ^ 中国气象数据网 (in Simplified Chinese). China Meteorological Administration. Retrieved 10 October 2023.
- ^ 中国地面国际交换站气候标准值月值数据集(1971-2000年). China Meteorological Administration. Archived from the original on 2013-09-21. Retrieved 2010-05-25.


