Category:Graph images that should be in SVG format
Images composed of simple shapes, lines, and letters such as those below should be recreated using vector graphics as an SVG file. These have a number of advantages, such as making it easier for subsequent editors to edit them, enabling arbitrary scaling at high quality, and sharp high-resolution renderings for print versions.
If an SVG version of any of these images becomes available, please tag the deprecated image with {{Vector version available|NewImage.svg}}.
This category is a subcategory of Category:Images that should be in SVG format. You can add images to this category using the template {{Should be SVG|graph}}. For more information, see Template:Should be SVG.
Almost all of these images are eligible to be transferred to Wikimedia Commons and should be tagged with {{move to commons}}.
See also
[edit]- Wikipedia:Collaboration to convert graphs to SVG
- Orphaned images in "Graph images that should be in SVG format"
Media in category "Graph images that should be in SVG format"
The following 109 files are in this category, out of 109 total.
-
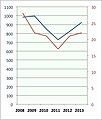
ACE 2008–13 voter and candidate numbers.jpg 325 × 382; 29 KB
-
ACE2013 support % for each candidate.jpg 581 × 382; 58 KB
-
Alexa reach measurement for wikipedia-logscale.png 480 × 328; 3 KB
-
Ashbyplot.png 600 × 450; 4 KB
-
Bell observers expansion.png 400 × 400; 28 KB
-
Bell observers.png 400 × 400; 35 KB
-
Bitcoin crash 2011-06-19.png 1,709 × 1,089; 451 KB
-
Cardrisk.jpg 491 × 285; 39 KB
-
Cbc128192256.jpg 1,024 × 717; 180 KB
-
Cbccfb.jpg 1,024 × 717; 132 KB
-
Chart mfr data 99-00.jpg 950 × 539; 190 KB
-
Cohabitation Approval General Social Survey 1994-2012 v2.png 320 × 286; 15 KB
-
Competitive equilibrium.jpg 640 × 400; 18 KB
-
Contrib pie Demiurge1000.PNG 494 × 238; 18 KB
-
Corprisk.jpg 420 × 315; 23 KB
-
Crime International.png 470 × 340; 17 KB
-
Data from National Vital Statistics Report tPx.png 623 × 434; 186 KB
-
Density-nd.GIF 911 × 623; 19 KB
-
DR vs SPR.jpg 276 × 302; 54 KB
-
Economists salary.png 473 × 246; 9 KB
-
Education Income.jpg 942 × 386; 129 KB
-
En-admins-articles-users-edits.png 1,037 × 636; 18 KB
-
EQ cluster.jpg 655 × 289; 35 KB
-
ESCO Savings Chart.JPG 256 × 237; 7 KB
-
Euler identity2.jpg 482 × 374; 19 KB
-
Example graph of SiTF.jpeg 779 × 435; 37 KB
-
EXIT chart.PNG 643 × 456; 20 KB
-
Exponential Decay Function.png 597 × 355; 23 KB
-
FAH-tflops.PNG 975 × 680; 41 KB
-
Fat contents of Yak Butter.jpg 1,337 × 1,341; 998 KB
-
FL stats by type (May 2008) barchart.png 866 × 456; 20 KB
-
Forumforcricket.JPG 603 × 417; 40 KB
-
FrancEuro1907-1959.png 585 × 415; 7 KB
-
Graph for the Signpost.png 992 × 673; 88 KB
-
Graph rel lvl indz 1750 1900 01.png 531 × 299; 4 KB
-
Great Ouseburn Employment Sectors.png 719 × 511; 173 KB
-
Heat Content of Zn(c,l,g).PNG 498 × 301; 13 KB
-
Homeownership by household type.jpg 581 × 335; 94 KB
-
Households vs Individuals Income.png 687 × 288; 16 KB
-
Impactadapt.jpg 600 × 237; 32 KB
-
Impactadapt2.jpg 600 × 363; 21 KB
-
Income and consumption inequality in Poland, Gini index.png 783 × 570; 33 KB
-
International Median Household Income.png 517 × 314; 10 KB
-
LampEfficiency.JPG 2,018 × 1,136; 190 KB
-
Likelihood.png 662 × 252; 5 KB
-
LMalingaBowling.png 1,175 × 606; 16 KB
-
Localregressionsmoother.jpg 900 × 557; 39 KB
-
Mass Affluent USA.jpg 572 × 352; 77 KB
-
Maxwellcoils.png 711 × 609; 7 KB
-
McColo-Spammonth.gif 379 × 263; 35 KB
-
Millington average temperatures 1981-2010.jpg 533 × 367; 44 KB
-
MTF example graph.jpg 794 × 548; 68 KB
-
NarrowBipolarEvent2.png 720 × 504; 24 KB
-
NOAA schematic of the Great Lakes.png 447 × 430; 147 KB
-
Number of temples chart.GIF 883 × 609; 13 KB
-
Number–duration ratios.jpg 591 × 556; 54 KB
-
Opinion polling for the Democratic Primaries, 2020.png 1,215 × 641; 144 KB
-
Orkney population chart.png 672 × 319; 42 KB
-
P-value Graph.png 415 × 274; 13 KB
-
PaychexSupportResistanceChart.JPG 757 × 621; 79 KB
-
Personal Household Income U.png 423 × 442; 13 KB
-
Personal income race.png 443 × 728; 17 KB
-
PoleZeroPlot.png 560 × 420; 4 KB
-
Polycarbonate IR transmission.png 3,345 × 2,250; 171 KB
-
POP15-16.GIF 570 × 570; 22 KB
-
POP15-20.GIF 570 × 570; 22 KB
-
Processgraph.png 976 × 480; 24 KB
-
Psoriasis severity.jpg 500 × 462; 91 KB
-
QuantumReflection.png 570 × 370; 18 KB
-
Religion in Ontario.png 901 × 559; 12 KB
-
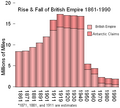
Riseandfall1.PNG 434 × 389; 12 KB
-
RiskVsReturn.jpg 600 × 463; 25 KB
-
RSAF Org Chart.png 933 × 353; 4 KB
-
Sampled-sines-cosines-aliasing.png 460 × 1,255; 72 KB
-
Sampledsine.png 560 × 420; 12 KB
-
Sampling FM at 44MHz.png 510 × 283; 7 KB
-
Sampling FM at 56MHz.png 510 × 283; 10 KB
-
Saskatchewan population growth.png 431 × 289; 2 KB
-
Sector antenna radiation pattern.png 293 × 155; 22 KB
-
Sin-phas.gif 608 × 351; 8 KB
-
Six figure income.png 453 × 307; 9 KB
-
Skmgraph.JPG 1,195 × 396; 25 KB
-
Sock Mitigation graph.png 464 × 279; 23 KB
-
Speech recognition threshold in noise2.jpg 779 × 521; 37 KB
-
Spidergraph ChemDurab.png 911 × 623; 43 KB
-
Spidergraph Dispersion.GIF 911 × 623; 21 KB
-
STJ IV Curve.jpg 400 × 358; 29 KB
-
Stress v strain A36 3.png 800 × 400; 13 KB
-
Stroke Rehab.pdf 604 × 587; 78 KB
-
Studio 60 Viewership.png 594 × 279; 31 KB
-
SuccessRatevsEditsatRfA.png 926 × 630; 17 KB
-
Supercrit2.jpg 421 × 323; 11 KB
-
Synthetic aerosol distribution in number area and volume space.png 1,320 × 1,784; 238 KB
-
Syro-Malabar Liturgical Calendar-2008.jpg 353 × 336; 26 KB
-
Teens.gif 861 × 715; 15 KB
-
Tritone paradox example.jpg 284 × 455; 52 KB
-
UK rail fatalities.png 620 × 392; 9 KB
-
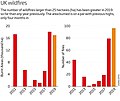
UK wildfires 2011-2019.jpg 344 × 289; 37 KB
-
UnexpectLoss.jpg 566 × 314; 30 KB
-
US Race Household Income.png 642 × 495; 24 KB
-
USCongressWarVote.png 454 × 301; 12 KB
-
VegasHomeAppreciation.png 624 × 366; 34 KB
-
Visible Minorities of Canada.png 811 × 570; 14 KB
-
Visible Minorities of Ontario.png 827 × 636; 14 KB
-
Voter turnout by country.png 769 × 556; 47 KB
-
Wikipedia Article Creation.png 1,100 × 813; 60 KB
-
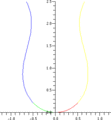
YoungLaplace example bridge.gif 394 × 161; 2 KB
-
YoungLaplace example drop.gif 318 × 344; 2 KB


