1964 United States presidential election in Florida
| ||||||||||||||||||||||||||
| Turnout | 74% | |||||||||||||||||||||||||
|---|---|---|---|---|---|---|---|---|---|---|---|---|---|---|---|---|---|---|---|---|---|---|---|---|---|---|
| ||||||||||||||||||||||||||
 County Results
| ||||||||||||||||||||||||||
| ||||||||||||||||||||||||||
| Elections in Florida |
|---|
 |
|
|
The 1964 United States presidential election in Florida was held November 3, 1964. All contemporary fifty states and the District of Columbia took part, and Florida voters selected fourteen electors to the Electoral College, who voted for president and vice president. Florida was the second-closest state won by Johnson, after Idaho.[1]
As of the 2020 presidential election[update], this is the last election in which the Democratic candidate carried Charlotte County.[2]
Campaign
[edit]
Retirement communities further south who were supportive of Republicans in presidential elections over the previous fifteen years, were opposed to Barry Goldwater’s desire to privatize Social Security and his criticism of the United States' space program.[3][4]
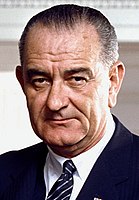
Lyndon B. Johnson won Florida by 42,599 votes, a margin of 2.30%, or a swing of 5.32% from the 1960 result. Increased registration of black voters, which reached 51%, was crucial to Johnson regaining Florida. In the northern counties of Lafayette and Liberty, where no black people were registered, massive swings toward Goldwater by white voters were completely unmitigated.[5]
However, amidst a national Democratic landslide, Florida weighed in as a massive 20.28% more Republican than the nation at large. Although Johnson carried 20 of the state's 67 counties, in only two of them, Monroe and Dade, did he exceed his nationwide vote share of 61.05%.[6]
Results
[edit]
| 1964 United States presidential election in Florida[1] | ||||||||
|---|---|---|---|---|---|---|---|---|
| Party | Candidate | Running mate | Popular vote | Electoral vote | ||||
| Count | % | Count | % | |||||
| Democratic | Lyndon Baines Johnson of Texas (incumbent) | Hubert Horatio Humphrey of Minnesota | 948,540 | 51.15% | 14 | 100.00% | ||
| Republican | Barry Goldwater of Arizona | William E. Miller of New York | 905,941 | 48.85% | 0 | 0.00% | ||
| Total | 1,854,841 | 100.00% | 14 | 100.00% | ||||
Results by county
[edit]| County[7] | Lyndon B. Johnson Democratic |
Barry Goldwater Republican |
Margin | Total votes cast | |||
|---|---|---|---|---|---|---|---|
| # | % | # | % | # | % | ||
| Alachua | 13,483 | 54.73% | 11,151 | 45.27% | 2,332 | 9.46% | 24,634 |
| Baker | 1,137 | 50.35% | 1,121 | 49.65% | 16 | 0.70% | 2,258 |
| Bay | 7,846 | 37.91% | 12,849 | 62.09% | -5,003 | -24.18% | 20,695 |
| Bradford | 2,320 | 53.87% | 1,987 | 46.13% | 333 | 7.74% | 4,307 |
| Brevard | 24,833 | 50.29% | 24,551 | 49.71% | 282 | 0.58% | 49,384 |
| Broward | 68,406 | 44.51% | 85,264 | 55.49% | -16,858 | -10.98% | 153,670 |
| Calhoun | 980 | 35.34% | 1,793 | 64.66% | -813 | -29.32% | 2,773 |
| Charlotte | 4,831 | 53.71% | 4,163 | 46.29% | 668 | 7.42% | 8,994 |
| Citrus | 2,521 | 51.98% | 2,329 | 48.02% | 192 | 3.96% | 4,850 |
| Clay | 3,114 | 45.01% | 3,805 | 54.99% | -691 | -9.98% | 6,919 |
| Collier | 2,877 | 44.55% | 3,581 | 55.45% | -704 | -10.90% | 6,458 |
| Columbia | 3,249 | 43.94% | 4,145 | 56.06% | -896 | -12.12% | 7,394 |
| Dade | 208,941 | 64.01% | 117,480 | 35.99% | 91,461 | 28.02% | 326,421 |
| DeSoto | 1,777 | 47.22% | 1,986 | 52.78% | -209 | -5.56% | 3,763 |
| Dixie | 923 | 50.41% | 908 | 49.59% | 15 | 0.82% | 1,831 |
| Duval | 79,365 | 49.45% | 81,116 | 50.55% | -1,751 | -1.10% | 160,481 |
| Escambia | 25,371 | 43.91% | 32,414 | 56.09% | -7,043 | -12.18% | 57,785 |
| Flagler | 940 | 56.69% | 718 | 43.31% | 222 | 13.38% | 1,658 |
| Franklin | 1,366 | 49.05% | 1,419 | 50.95% | -53 | -1.90% | 2,785 |
| Gadsden | 4,556 | 46.67% | 5,207 | 53.33% | -651 | -6.66% | 9,763 |
| Gilchrist | 711 | 56.83% | 540 | 43.17% | 171 | 13.66% | 1,251 |
| Glades | 441 | 44.91% | 541 | 55.09% | -100 | -10.18% | 982 |
| Gulf | 1,659 | 45.33% | 2,001 | 54.67% | -342 | -9.34% | 3,660 |
| Hamilton | 1,302 | 52.93% | 1,158 | 47.07% | 144 | 5.86% | 2,460 |
| Hardee | 1,908 | 45.12% | 2,321 | 54.88% | -413 | -9.76% | 4,229 |
| Hendry | 1,352 | 45.04% | 1,650 | 54.96% | -298 | -9.92% | 3,002 |
| Hernando | 2,320 | 49.82% | 2,337 | 50.18% | -17 | -0.36% | 4,657 |
| Highlands | 4,233 | 47.14% | 4,747 | 52.86% | -514 | -5.72% | 8,980 |
| Hillsborough | 71,289 | 58.48% | 50,616 | 41.52% | 20,673 | 16.96% | 121,905 |
| Holmes | 1,193 | 27.00% | 3,225 | 73.00% | -2,032 | -46.00% | 4,418 |
| Indian River | 5,122 | 45.28% | 6,191 | 54.72% | -1,069 | -9.44% | 11,313 |
| Jackson | 4,386 | 38.31% | 7,064 | 61.69% | -2,678 | -23.38% | 11,450 |
| Jefferson | 1,504 | 47.18% | 1,684 | 52.82% | -180 | -5.64% | 3,188 |
| Lafayette | 545 | 45.68% | 648 | 54.32% | -103 | -8.64% | 1,193 |
| Lake | 7,773 | 37.61% | 12,897 | 62.39% | -5,124 | -24.78% | 20,670 |
| Lee | 10,204 | 44.19% | 12,886 | 55.81% | -2,682 | -11.62% | 23,090 |
| Leon | 10,927 | 41.85% | 15,181 | 58.15% | -4,254 | -16.30% | 26,108 |
| Levy | 1,986 | 55.69% | 1,580 | 44.31% | 406 | 11.38% | 3,566 |
| Liberty | 377 | 29.29% | 910 | 70.71% | -533 | -41.42% | 1,287 |
| Madison | 2,121 | 42.91% | 2,822 | 57.09% | -701 | -14.18% | 4,943 |
| Manatee | 13,074 | 43.26% | 17,147 | 56.74% | -4,073 | -13.48% | 30,221 |
| Marion | 9,112 | 45.58% | 10,879 | 54.42% | -1,767 | -8.84% | 19,991 |
| Martin | 3,621 | 45.76% | 4,292 | 54.24% | -671 | -8.48% | 7,913 |
| Monroe | 8,936 | 64.86% | 4,842 | 35.14% | 4,094 | 29.72% | 13,778 |
| Nassau | 2,781 | 47.02% | 3,134 | 52.98% | -353 | -5.96% | 5,915 |
| Okaloosa | 7,890 | 44.20% | 9,961 | 55.80% | -2,071 | -11.60% | 17,851 |
| Okeechobee | 1,016 | 43.57% | 1,316 | 56.43% | -300 | -12.86% | 2,332 |
| Orange | 38,248 | 43.90% | 48,884 | 56.10% | -10,636 | -12.20% | 87,132 |
| Osceola | 3,531 | 43.88% | 4,516 | 56.12% | -985 | -12.24% | 8,047 |
| Palm Beach | 43,836 | 46.91% | 49,614 | 53.09% | -5,778 | -6.18% | 93,450 |
| Pasco | 8,135 | 51.68% | 7,606 | 48.32% | 529 | 3.36% | 15,741 |
| Pinellas | 98,381 | 55.02% | 80,414 | 44.98% | 17,967 | 10.04% | 178,795 |
| Polk | 29,355 | 44.98% | 35,906 | 55.02% | -6,551 | -10.04% | 65,261 |
| Putnam | 4,995 | 49.62% | 5,072 | 50.38% | -77 | -0.76% | 10,067 |
| St. Johns | 4,357 | 36.90% | 7,450 | 63.10% | -3,093 | -26.20% | 11,807 |
| St. Lucie | 7,748 | 51.82% | 7,204 | 48.18% | 544 | 3.64% | 14,952 |
| Santa Rosa | 3,570 | 37.37% | 5,983 | 62.63% | -2,413 | -25.26% | 9,553 |
| Sarasota | 13,937 | 38.87% | 21,917 | 61.13% | -7,980 | -22.26% | 35,854 |
| Seminole | 9,125 | 47.52% | 10,078 | 52.48% | -953 | -4.96% | 19,203 |
| Sumter | 2,259 | 58.07% | 1,631 | 41.93% | 628 | 16.14% | 3,890 |
| Suwannee | 2,393 | 44.36% | 3,002 | 55.64% | -609 | -11.28% | 5,395 |
| Taylor | 1,708 | 39.09% | 2,661 | 60.91% | -953 | -21.82% | 4,369 |
| Union | 740 | 51.03% | 710 | 48.97% | 30 | 2.06% | 1,450 |
| Volusia | 34,901 | 58.28% | 24,988 | 41.72% | 9,913 | 16.56% | 59,889 |
| Wakulla | 753 | 37.22% | 1,270 | 62.78% | -517 | -25.56% | 2,023 |
| Walton | 2,449 | 39.49% | 3,753 | 60.51% | -1,304 | -21.02% | 6,202 |
| Washington | 1,500 | 35.50% | 2,725 | 64.50% | -1,225 | -29.00% | 4,225 |
| Totals | 948,540 | 51.15% | 905,941 | 48.85% | 42,599 | 2.30% | 1,854,481 |
Counties that flipped from Democratic to Republican
[edit]- Bay
- Calhoun
- Clay
- Columbia
- Duval
- Escambia
- Franklin
- Glades
- Gadsden
- Gulf
- Hendry
- Hernando
- Holmes
- Jackson
- Jefferson
- Lafayette
- Leon
- Liberty
- Madison
- Marion
- Nassau
- Okaloosa
- Okeechobee
- Putnam
- St. Johns
- Santa Rosa
- Suwannee
- Taylor
- Walton
- Washington
- Wakulla
Counties that flipped from Republican to Democratic
[edit]References
[edit]- ^ a b Leip, David. "Dave Leip's Atlas of U.S. Presidential Elections". uselectionatlas.org. Retrieved April 7, 2017.
- ^ Sullivan, Robert David; ‘How the Red and Blue Map Evolved Over the Past Century’; America Magazine in The National Catholic Review; June 29, 2016
- ^ Phillips; The Emerging Republican Majority, p. 224
- ^ Black & Black 1992, p. 206.
- ^ Bullock, Charles S. and Gaddie, Ronald Keith; The Triumph of Voting Rights in the South, p. 254 ISBN 0806185309
- ^ Bullock, Charles S. and Gaddie, Ronald Keith; The Triumph of Voting Rights in the South, p. 254 ISBN 0806185309
- ^ Adams, Tom (1964). TABULATION OF OFFICIAL VOTES CAST IN THE GENERAL ELECTION: NOVEMBER 3, 1964 – via Internet Archive.


