Salinas de Garci Mendoza
Salinas de Garci Mendoza | |
|---|---|
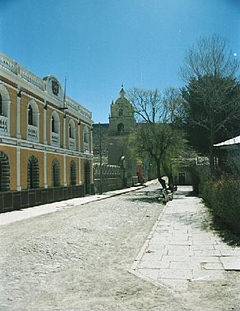
 Municipal building and church at the main square | |
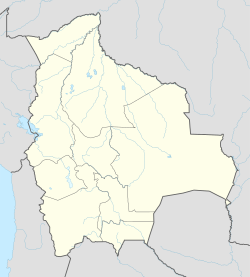
| Coordinates: 19°38′15″S 67°40′31″W / 19.63750°S 67.67528°W | |
| Country | |
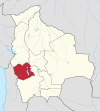
| Department | |
| Province | Ladislao Cabrera Province |
| Elevation | 12,244 ft (3,732 m) |
| Population (2001) | |
| • Total | 584 |
| Time zone | UTC-4 (BOT) |

Salinas de Garci Mendoza (formerly: Salinas de Thunupa) is a town in the Bolivian Oruro Department. It is the administrative center of Ladislao Cabrera Province and is located 280 km (170 mi) south-west of Oruro, the capital of the department. It is situated at an elevation of 3,732 m (12,244 ft) at Caricha (4,227 m or 13,868 ft), 20 km north of the Tunupa stratovolcano. Salar de Coipasa,a salt lake, is 20 km north-west of Salinas de Garci Mendoza, and 15 km in south-eastern direction is Salar de Uyuni, the world's largest salt pan. Salinas de Garci Mendoza is the endpoint of the road from Chuquichamba via Andamarca and Aroma to Salinas de Garci Mendoza.
Salinas de Garci Mendoza bears the title "Capital of Quinoa" because of the intensive cultivation of the quinoa crop in this area.
Climate
[edit]| Climate data for Salinas de Garci Mendoza, elevation 3,860 m (12,660 ft) | |||||||||||||
|---|---|---|---|---|---|---|---|---|---|---|---|---|---|
| Month | Jan | Feb | Mar | Apr | May | Jun | Jul | Aug | Sep | Oct | Nov | Dec | Year |
| Mean daily maximum °C (°F) | 22.1 (71.8) |
21.5 (70.7) |
21.0 (69.8) |
20.1 (68.2) |
16.9 (62.4) |
14.5 (58.1) |
14.7 (58.5) |
15.9 (60.6) |
18.3 (64.9) |
21.1 (70.0) |
22.7 (72.9) |
22.9 (73.2) |
19.3 (66.8) |
| Daily mean °C (°F) | 13.2 (55.8) |
12.5 (54.5) |
11.9 (53.4) |
9.6 (49.3) |
6.2 (43.2) |
3.8 (38.8) |
3.7 (38.7) |
5.0 (41.0) |
7.6 (45.7) |
9.9 (49.8) |
11.7 (53.1) |
13.1 (55.6) |
9.0 (48.2) |
| Mean daily minimum °C (°F) | 4.3 (39.7) |
3.4 (38.1) |
2.7 (36.9) |
−0.8 (30.6) |
−4.5 (23.9) |
−6.0 (21.2) |
−6.9 (19.6) |
−5.7 (21.7) |
−3.1 (26.4) |
−1.4 (29.5) |
0.6 (33.1) |
3.4 (38.1) |
−1.2 (29.9) |
| Average precipitation mm (inches) | 89.1 (3.51) |
27.1 (1.07) |
46.6 (1.83) |
0.0 (0.0) |
1.9 (0.07) |
0.0 (0.0) |
0.0 (0.0) |
2.5 (0.10) |
0.0 (0.0) |
7.2 (0.28) |
5.0 (0.20) |
34.3 (1.35) |
213.7 (8.41) |
| Average precipitation days | 9.2 | 3.3 | 5.0 | 0.0 | 0.2 | 0.0 | 0.0 | 0.2 | 0.0 | 1.4 | 1.2 | 4.8 | 25.3 |
| Average relative humidity (%) | 55.3 | 56.7 | 58.3 | 56.4 | 56.0 | 53.6 | 45.7 | 47.0 | 50.8 | 50.2 | 51.2 | 51.0 | 52.7 |
| Source 1: Plataforma digital única del Estado Peruano[1] | |||||||||||||
| Source 2: Servicio Nacional de Meteorología e Hidrología de Bolivia (precipitation and humidity 1991–2011)[2][3] | |||||||||||||
See also
[edit]References
[edit]- ^ "PLAN DIRECTOR GLOBAL BINACIONAL DE PROTECCION - PREVENCION DE INUNDACIONES V APROVECHAMIENTO DE LOS RECURSOS DEL LAGO TITICACA, RIO DESAGUADERO, LAGO POOPO V LAGO SALAR E COIPASA (SISTEMA T.D.P.S.) ESTUDIO DE CLIMATOLOGIA" (PDF). The European Commission (EC). Archived from the original (PDF) on 11 June 2024. Retrieved 15 June 2024.
- ^ "Base de datos Sistema Meteorológico–SISMET" (in Spanish). Servicio Nacional de Meteorología e Hidrología de Bolivia. Archived from the original on 7 June 2018. Retrieved 15 June 2024.
- ^ "índices climáticos para 149 estaciones meteorológicas en Bolivia" (in Spanish). Servicio Nacional de Meteorología e Hidrología de Bolivia. Retrieved 15 June 2024.


