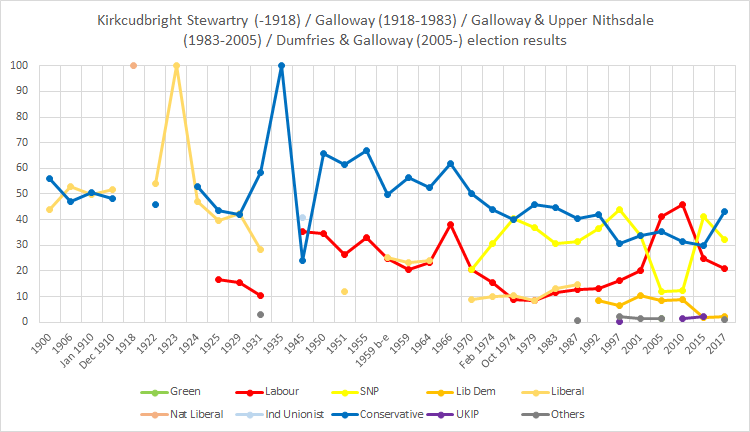
Galloway (UK Parliament constituency)
Appearance
| Galloway | |
|---|---|
| Former county constituency for the House of Commons | |
| 1918–1983 | |
| Seats | One |
| Created from | Kirkcudbrightshire and Wigtownshire |
| Replaced by | Galloway and Upper Nithsdale |
Galloway was a county constituency in the Galloway area of Scotland. It elected one Member of Parliament (MP) to the House of Commons of the Parliament of the United Kingdom, by the first past the post voting system.
It was created for the 1918 general election, and abolished for the 1983 general election, when it was partly replaced by the new Galloway and Upper Nithsdale constituency.
Members of Parliament
[edit]| Election | Member | Party | |
|---|---|---|---|
| 1918 | Gilbert McMicking | Coalition Liberal | |
| 1922 | Cecil Dudgeon | Liberal | |
| 1924 | Sir Arthur Henniker-Hughan, Bt. | Unionist | |
| 1925 by-election | Sidney Streatfeild | Unionist | |
| 1929 | Cecil Dudgeon | Liberal | |
| 1931 | New Party | ||
| 1931 | John Mackie | Unionist | |
| 1959 by-election | John Brewis | Unionist | |
| Oct 1974 | George Thompson | SNP | |
| 1979 | Ian Lang | Conservative | |
| 1983 | constituency abolished | ||
Election results
[edit]
Elections in the 1910s
[edit]
| Party | Candidate | Votes | % | ±% | |
|---|---|---|---|---|---|
| C | Liberal | Gilbert McMicking | Unopposed | ||
| Liberal win (new seat) | |||||
| C indicates candidate endorsed by the coalition government. | |||||
Elections in the 1920s
[edit]| Party | Candidate | Votes | % | ±% | |
|---|---|---|---|---|---|
| Liberal | Cecil Dudgeon | 12,406 | 54.0 | N/A | |
| Unionist | William Watson | 10,557 | 46.0 | New | |
| Majority | 1,849 | 8.0 | N/A | ||
| Turnout | 22,963 | 77.5 | N/A | ||
| Registered electors | 29,645 | ||||
| Liberal hold | Swing | N/A | |||
| Party | Candidate | Votes | % | ±% | |
|---|---|---|---|---|---|
| Liberal | Cecil Dudgeon | Unopposed | |||
| Liberal hold | |||||
| Party | Candidate | Votes | % | ±% | |
|---|---|---|---|---|---|
| Unionist | Arthur Henniker-Hughan | 12,268 | 53.1 | New | |
| Liberal | Cecil Dudgeon | 10,852 | 46.9 | N/A | |
| Majority | 1,416 | 6.2 | N/A | ||
| Turnout | 23,120 | 76.8 | N/A | ||
| Registered electors | 30,107 | ||||
| Unionist gain from Liberal | Swing | N/A | |||
| Party | Candidate | Votes | % | ±% | |
|---|---|---|---|---|---|
| Unionist | Sidney Streatfeild | 10,846 | 43.5 | −9.6 | |
| Liberal | Cecil Dudgeon | 9,918 | 39.7 | −7.2 | |
| Labour | J. Mitchell | 4,207 | 16.8 | New | |
| Majority | 928 | 3.8 | −2.4 | ||
| Turnout | 24,971 | 83.3 | +6.5 | ||
| Registered electors | 29,992 | ||||
| Unionist hold | Swing | −1.2 | |||
| Party | Candidate | Votes | % | ±% | |
|---|---|---|---|---|---|
| Liberal | Cecil Dudgeon | 13,461 | 42.4 | −4.5 | |
| Unionist | Sidney Streatfeild | 13,360 | 42.1 | −11.0 | |
| Labour | Hector McNeil | 4,903 | 15.5 | N/A | |
| Majority | 101 | 0.3 | N/A | ||
| Turnout | 31,724 | 80.1 | +3.3 | ||
| Registered electors | 39,621 | ||||
| Liberal gain from Unionist | Swing | +3.0 | |||
Elections in the 1930s
[edit]| Party | Candidate | Votes | % | ±% | |
|---|---|---|---|---|---|
| Unionist | John Mackie | 18,993 | 58.3 | +16.2 | |
| Liberal | Edward Maitland Campbell | 9,176 | 28.2 | −14.2 | |
| Labour | Hector McNeil | 3,418 | 10.5 | −5.0 | |
| New Party | Cecil Dudgeon | 986 | 3.0 | New | |
| Majority | 9,817 | 30.1 | N/A | ||
| Turnout | 32,573 | ||||
| Unionist gain from Liberal | Swing | +2.1 | |||
| Party | Candidate | Votes | % | ±% | |
|---|---|---|---|---|---|
| Unionist | John Mackie | Unopposed | N/A | N/A | |
| Unionist hold | |||||
Elections in the 1940s
[edit]General Election 1939–40
Another General Election was required to take place before the end of 1940. The political parties had been making preparations for an election to take place from 1939 and by the end of this year, the following candidates had been selected;
- Unionist: John Mackie
| Party | Candidate | Votes | % | ±% | |
|---|---|---|---|---|---|
| Ind. Unionist | John Mackie | 13,647 | 40.74 | N/A | |
| Labour | Robert N Hales | 11,822 | 35.29 | New | |
| Unionist | B Fergusson | 8,032 | 23.98 | N/A | |
| Majority | 1,825 | 5.45 | N/A | ||
| Turnout | 33,501 | 70.07 | N/A | ||
| Ind. Unionist gain from Unionist | Swing | N/A | |||
Elections in the 1950s
[edit]| Party | Candidate | Votes | % | ±% | |
|---|---|---|---|---|---|
| Unionist | John Mackie | 19,136 | 65.55 | ||
| Labour | Alan Thompson | 10,056 | 34.45 | ||
| Majority | 9,080 | 31.10 | |||
| Turnout | 29,192 | ||||
| Unionist gain from Ind. Unionist | Swing | ||||
| Party | Candidate | Votes | % | ±% | |
|---|---|---|---|---|---|
| Unionist | John Mackie | 16,261 | 61.63 | ||
| Labour | Alan Thompson | 6,949 | 26.34 | ||
| Liberal | Robert Tordiff Johnston | 3,174 | 12.03 | ||
| Majority | 9,312 | 35.29 | |||
| Turnout | 26,384 | ||||
| Unionist hold | Swing | ||||
| Party | Candidate | Votes | % | ±% | |
|---|---|---|---|---|---|
| Unionist | John Mackie | 15,893 | 66.86 | +5.23 | |
| Labour | William S Gray | 7,879 | 33.14 | +6.80 | |
| Majority | 8,014 | 33.72 | –1.43 | ||
| Turnout | 23,772 | ||||
| Unionist hold | Swing | ||||
| Party | Candidate | Votes | % | ±% | |
|---|---|---|---|---|---|
| Unionist | John Brewis | 13,204 | 49.93 | −16.93 | |
| Liberal | Simon Mackay | 6,721 | 25.42 | New | |
| Labour | W Cross | 6,520 | 24.65 | −8.49 | |
| Majority | 6,483 | 24.51 | −9.20 | ||
| Turnout | 26,445 | ||||
| Unionist hold | Swing | ||||
| Party | Candidate | Votes | % | ±% | |
|---|---|---|---|---|---|
| Unionist | John Brewis | 15,454 | 56.29 | ||
| Liberal | Simon Mackay | 6,412 | 23.35 | ||
| Labour | James Pickett | 5,590 | 20.36 | ||
| Majority | 9,042 | 32.94 | |||
| Turnout | 27,456 | ||||
| Unionist hold | Swing | ||||
Elections in the 1960s
[edit]| Party | Candidate | Votes | % | ±% | |
|---|---|---|---|---|---|
| Unionist | John Brewis | 14,530 | 52.74 | ||
| Liberal | Simon Mackay | 6,619 | 24.03 | ||
| Labour | JP Gordon | 6,401 | 23.23 | ||
| Majority | 7,911 | 28.71 | |||
| Turnout | 27,550 | ||||
| Unionist hold | Swing | ||||
| Party | Candidate | Votes | % | ±% | |
|---|---|---|---|---|---|
| Conservative | John Brewis | 15,137 | 61.99 | ||
| Labour | D Douglas | 9,283 | 38.01 | ||
| Majority | 5,854 | 23.98 | |||
| Turnout | 24,420 | ||||
| Conservative hold | Swing | ||||
Elections in the 1970s
[edit]| Party | Candidate | Votes | % | ±% | |
|---|---|---|---|---|---|
| Conservative | John Brewis | 14,003 | 50.28 | ||
| SNP | Arthur Donaldson | 5,723 | 20.55 | New | |
| Labour | D Douglas | 5,665 | 20.34 | ||
| Liberal | Christopher B.H. Scott | 2,461 | 8.84 | New | |
| Majority | 8,280 | 29.73 | |||
| Turnout | 27,852 | ||||
| Conservative hold | Swing | ||||
| Party | Candidate | Votes | % | ±% | |
|---|---|---|---|---|---|
| Conservative | John Brewis | 13,316 | 43.86 | ||
| SNP | George Thompson | 9,308 | 30.66 | ||
| Liberal | David R. Hannay | 4,643 | 15.29 | ||
| Labour | H Chalmers | 3,091 | 10.18 | ||
| Majority | 4,008 | 13.20 | |||
| Turnout | 30,358 | ||||
| Conservative hold | Swing | ||||
| Party | Candidate | Votes | % | ±% | |
|---|---|---|---|---|---|
| SNP | George Thompson | 12,242 | 40.3 | +9.6 | |
| Conservative | Kenneth Alexander Ross | 12,212 | 40.2 | −3.7 | |
| Liberal | David R. Hannay | 3,181 | 10.5 | +0.2 | |
| Labour | TG Fulton | 2,742 | 9.0 | −6.2 | |
| Majority | 30 | 0.1 | N/A | ||
| Turnout | 30,377 | ||||
| SNP gain from Conservative | Swing | ||||
| Party | Candidate | Votes | % | ±% | |
|---|---|---|---|---|---|
| Conservative | Ian Lang | 15,306 | 45.8 | +5.6 | |
| SNP | George Thompson | 12,384 | 37.1 | −3.2 | |
| Liberal | David R. Hannay | 2,852 | 8.5 | −2.0 | |
| Labour | DD Johnston | 2,841 | 8.5 | −0.5 | |
| Majority | 2,922 | 8.7 | N/A | ||
| Turnout | 33,333 | ||||
| Conservative gain from SNP | Swing | ||||
References
[edit]- Craig, F. W. S. (1983) [1969]. British parliamentary election results 1918–1949 (3rd ed.). Chichester: Parliamentary Research Services. ISBN 0-900178-06-X.
- Leigh Rayment's Historical List of MPs – Constituencies beginning with "G" (part 1)
