Demographics of Bristol
| Demographics of Bristol | |
|---|---|
 Population pyramid of Bristol | |
| Population | 428,234 (2011) |

Bristol, England is the tenth most populous city in the United Kingdom.

Population
[edit]Bristol's total population, according to the 2011 UK census, was 428,234. The population density was 4,022 people per square km.
Ethnicity
[edit]
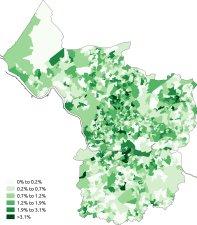
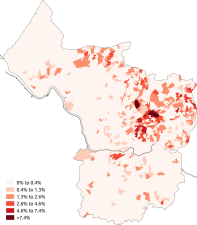
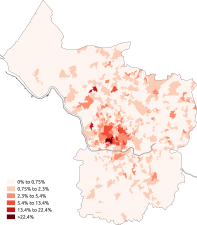
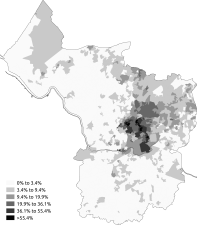
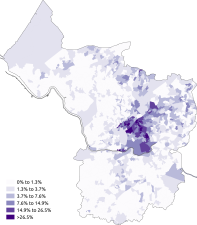
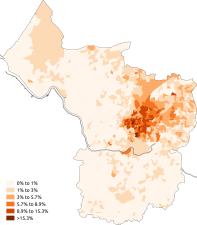
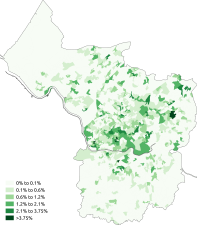
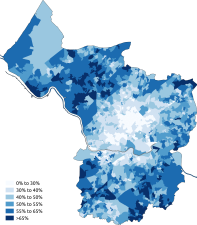
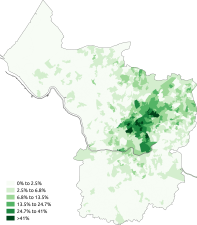
The following table shows the ethnic group of respondents in the 1991, 2001 and 2011 censuses in Bristol. Bristol has a strong White majority population, at 84%, which has declined from 94.5% in 1991. The largest ethnic group is the White British at 77.9% which have declined from 88% of the population in 2001. Black British residents are the 2nd biggest at 6% with Asian British at 5.5%.
| Ethnic Group | 1971 estimations[1] | 1981 estimations[2] | 1991 census[3][4] | 2001 census[5] | 2011 census[6] | 2021 census[7] | ||||||
|---|---|---|---|---|---|---|---|---|---|---|---|---|
| Number | % | Number | % | Number | % | Number | % | Number | % | Number | % | |
| White: Total | 396,543 | 97.7% | 381,764 | 95.7% | 376,418 | 94.8% | 349,530 | 91.83% | 359,592 | 83.97% | 383,142 | 81.1% |
| White: British | – | – | – | – | – | – | 335,085 | 88.04% | 333,432 | 77.86% | 338,452 | 71.6% |
| White: Irish | – | – | – | – | 5,571 | 1.48% | 4,321 | 1.14% | 3,851 | 0.90% | 4288 | 0.9% |
| White: Gypsy or Irish Traveller[note 1] | – | – | – | – | – | – | – | – | 359 | 0.08% | 273 | 0.1% |
| White: Roma | – | – | – | – | – | – | – | – | – | – | 966 | 0.2% |
| White: Other | – | – | – | – | – | – | 10,124 | 2.66% | 21,950 | 5.13% | 39,163 | 8.3% |
| Asian or Asian British: Total | – | – | 6,583 | 1.6% | 8,479 | 2.1% | 13,008 | 3.42% | 23,655 | 5.52% | 31,269 | 6.7% |
| Asian or Asian British: Indian | – | – | 2,420 | 2,969 | 4,595 | 1.21% | 6,547 | 1.53% | 8,302 | 1.8% | ||
| Asian or Asian British: Pakistani | – | – | 2,422 | 2,931 | 4,050 | 1.06% | 6,863 | 1.60% | 9,064 | 1.9% | ||
| Asian or Asian British: Bangladeshi | – | – | 334 | 602 | 1,230 | 0.32% | 2,104 | 0.49% | 2,616 | 0.6% | ||
| Asian or Asian British: Chinese[note 2] | – | – | 867 | 1,165 | 2,149 | 0.56% | 3,886 | 0.91% | 5,466 | 1.2% | ||
| Asian or Asian British: Other Asian | – | – | 540 | 812 | 984 | 0.26% | 4,255 | 0.99% | 5,821 | 1.2% | ||
| Black or Black British: Total | – | – | 8,599 | 2.2% | 9,507 | 2.4% | 8,831 | 2.32% | 25,734 | 6.01% | 27,890 | 5.8% |
| Black or Black British: African | – | – | 678 | 786 | 2,310 | 0.61% | 12,085 | 2.82% | 18,149 | 3.8% | ||
| Black or Black British: Caribbean | – | – | 5,918 | 1.5% | 6,409 | 1.6% | 5,585 | 1.47% | 6,727 | 1.57% | 6,803 | 1.4% |
| Black or Black British: Other Black | – | – | 2,003 | 2,312 | 936 | 0.25% | 6,922 | 1.62% | 2,938 | 0.6% | ||
| Mixed: Total | – | – | – | – | – | – | 7,934 | 2.08% | 15,438 | 3.61% | 21,116 | 4.5% |
| Mixed: White and Black Caribbean | – | – | – | – | – | – | 3,871 | 1.02% | 7,389 | 1.73% | 7,714 | 1.6% |
| Mixed: White and Black African | – | – | – | – | – | – | 755 | 0.20% | 1,533 | 0.36% | 2,621 | 0.6% |
| Mixed: White and Asian | – | – | – | – | – | – | 1,652 | 0.43% | 3,402 | 0.79% | 5,556 | 1.2% |
| Mixed: Other Mixed | – | – | – | – | – | – | 1,656 | 0.44% | 3,114 | 0.73% | 5,225 | 1.1% |
| Other: Total | – | – | 2,135 | 2,595 | 1,312 | 0.34% | 3,815 | 0.89% | 9,050 | 1.9% | ||
| Other: Arab[note 3] | – | – | – | – | – | – | – | – | 1,272 | 0.30% | 2,540 | 0.5% |
| Other: Any other ethnic group | – | – | – | – | – | – | 1,312 | 0.34% | 2,543 | 0.59% | 6,510 | 1.4% |
| Ethnic minority: Total | 9,499 | 2.3% | 17,317 | 4.3% | 20,581 | 5.2% | 31,085 | 8.2% | 68,642 | 16% | 89,325 | 18.9% |
| Total | 406,042 | 100% | 399,081 | 100% | 396,999 | 100% | 380,615 | 100% | 428,234 | 100% | 472,467 | 100% |
Notes for table above
| Ethnic group | School year[8][9] | |||
|---|---|---|---|---|
| 1971[10] | 2021/2022 | |||
| Number | % | Number | % | |
| White: Total | – | 96.1% | 42,959 | 67.9% |
| White: British | – | – | 37,628 | 59.5% |
| White: Irish | – | – | 175 | |
| White: Traveller of Irish heritage | – | – | 44 | |
| White: Gypsy/Roma | – | – | 110 | |
| White: Other | – | – | 5,002 | |
| Asian / Asian British: Total | – | – | 5,380 | 8.5% |
| Asian / Asian British: Indian | – | – | 1,337 | |
| Asian / Asian British: Pakistani | – | – | 1,969 | |
| Asian / Asian British: Bangladeshi | – | – | 524 | |
| Asian / Asian British: Chinese | – | – | 396 | |
| Asian / Asian British: Other Asians | – | – | 1,154 | |
| Black / Black British: Total | – | – | 6,649 | 10.5% |
| Black: Caribbean | – | – | 905 | |
| Black: African | – | – | 4,731 | |
| Black: Other Blacks | – | – | 1,013 | |
| Mixed / British Mixed | – | – | 5,999 | 9.5% |
| Other: Total | – | – | 977 | 1.5% |
| Unclassified | – | – | 1,309 | 2.1% |
| Non-White: Total | – | 3.9% | 19,005 | 32.1% |
| Total: | – | 100% | 63,273 | 100% |
Languages
[edit]The most common main languages spoken in Bristol according to the 2011 census are shown below.[11]
| Rank | Language | Usual residents aged 3+ | Proportion |
|---|---|---|---|
| 1 | English | 374,709 | 91.46% |
| 2 | Polish | 6,080 | 1.48% |
| 3 | Somali | 5,004 | 1.22% |
| 4 | Urdu | 1,432 | 0.35% |
| 5 | French | 1,403 | 0.34% |
| 6 | Spanish | 1,329 | 0.32% |
| 7 | Punjabi | 1,306 | 0.32% |
| 8 | Arabic | 1,103 | 0.27% |
| 9 | Bengali (with Sylheti and Chatgaya) | 983 | 0.24% |
| 10 | Italian | 964 | 0.24% |
| 11 | Portuguese | 850 | 0.21% |
| 12 | German | 732 | 0.18% |
| 13 | Hungarian | 664 | 0.16% |
| 14 | Malayalam and Tamil | 663 | 0.16% |
| 15 | Russian | 536 | 0.13% |
| 16 | Tagalog/Filipino | 531 | 0.13% |
| 17 | Kurdish | 516 | 0.13% |
| 18 | Romanian | 503 | 0.12% |
| 19 | Greek | 494 | 0.12% |
| 20 | Slovak | 493 | 0.12% |
| other | 9,403 | 2.30% |
Religion
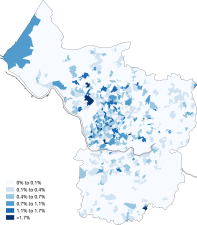
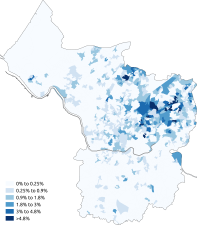
[edit]The following table shows the religion of respondents in the 2001, 2011 and 2021 censuses in Bristol.
| Religion | 2001[12] | 2011[13] | 2021[14] | |||
|---|---|---|---|---|---|---|
| Number | % | Number | % | Number | % | |
| No religion | 93,322 | 24.52 | 160,218 | 37.41 | 242,864 | 51.4 |
| Holds religious beliefs | 251,989 | 66.20 | 233,234 | 54.47 | 197,180 | 41.7 |
| 236,239 | 62.07 | 200,254 | 46.76 | 152,126 | 32.2 | |
| 7,664 | 2.01 | 22,016 | 5.14 | 31,776 | 6.7 | |
| 1,614 | 0.42 | 2,549 | 0.60 | 2,710 | 0.6 | |
| 2,131 | 0.56 | 2,712 | 0.63 | 3,545 | 0.8 | |
| 1,778 | 0.47 | 2,133 | 0.50 | 2,247 | 0.5 | |
| 823 | 0.22 | 777 | 0.18 | 1,228 | 0.3 | |
| Other religion | 1,740 | 0.46 | 2,793 | 0.65 | 3,546 | 0.8 |
| Religion not stated | 35,304 | 9.28 | 34,782 | 8.12 | 32,423 | 6.9 |
| Total population | 380,615 | 100.0 | 428,234 | 100.0 | 472,467 | 100.0 |
See also
[edit]- Demographics of the United Kingdom
- Demographics of England
- Demographics of London
- Demographics of Birmingham
- Demographics of Greater Manchester
- List of English cities by population
- List of English districts by population
- List of English districts and their ethnic composition
- List of English districts by area
- List of English districts by population density
References
[edit]- ^ Jones, P. N. (1978). "The Distribution and Diffusion of the Coloured Population in England and Wales, 1961-71". Transactions of the Institute of British Geographers. 3 (4): 515–532. Bibcode:1978TrIBG...3..515J. doi:10.2307/622127. ISSN 0020-2754. JSTOR 622127. PMID 12157820.
- ^ Surveys, Great Britain Office of Population Censuses and (1996). Ethnicity in the 1991 Census: Demographic characteristics of the ethnic minority populations. H.M. Stationery Office. ISBN 978-0-11-691655-6.
- ^ Surveys, Great Britain Office of Population Censuses and (1996). Ethnicity in the 1991 Census: Demographic characteristics of the ethnic minority populations. H.M. Stationery Office. ISBN 978-0-11-691655-6.
- ^ Data is taken from United Kingdom Casweb Data services of the United Kingdom 1991 Census on Ethnic Data for England, Scotland and Wales Archived 5 April 2022 at the Wayback Machine (Table 6)
- ^ "Office of National Statistics; 2001 Census Key Statistics". webarchive.nationalarchives.gov.uk. Retrieved 7 September 2021.
- ^ "2011 Census: Ethnic Group, local authorities in England and Wales". webarchive.nationalarchives.gov.uk. Retrieved 15 December 2021.
- ^ "Ethnic group - Office for National Statistics". www.ons.gov.uk. Retrieved 29 November 2022.
- ^ "School and pupil characteristics". webarchive.nationalarchives.gov.uk. Retrieved 8 November 2022.
- ^ "Schools, pupils and their characteristics, Academic Year 2021/22". explore-education-statistics.service.gov.uk. Retrieved 9 September 2022.
- ^ "Immigrants - Volume 837: debated on Monday 22 May 1972 - Hansard".
- ^ "Download:local authorities: county / unitary". NOMIS. Retrieved 5 November 2015.
- ^ "KS007 - Religion - Nomis - 2001". www.nomisweb.co.uk. Retrieved 18 October 2022.
- ^ "KS209EW (Religion) - Nomis - 2011". www.nomisweb.co.uk. Retrieved 18 October 2022.
- ^ "Religion - 2021 census". Office of National Statistics. 29 November 2022. Archived from the original on 29 November 2022. Retrieved 16 December 2022.


