Colorado Democratic Party
Colorado Democratic Party | |
|---|---|
| Chairperson | Shad Murib |
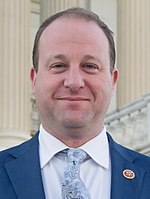
| Governor | Jared Polis |
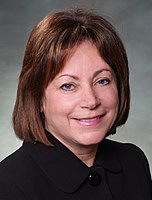
| Lieutenant Governor | Dianne Primavera |
| Senate President | Steve Fenberg |
| House Speaker | Julie McCluskie |
| Headquarters | Denver, Colorado |
| Membership (2024) | |
| Ideology | Modern liberalism |
| National affiliation | Democratic Party |
| Colors | Blue |
| U.S. Senate | 2 / 2 |
| U.S. House | 5 / 8 |
| Statewide offices | 5 / 5 |
| Colorado Senate | 23 / 35 |
| Colorado House of Representatives | 46 / 65 |
| Colorado State Board of Education | 6 / 9 |
| University of Colorado Board of Regents | 5 / 9 |
| Website | |
| www | |
The Colorado Democratic Party is the affiliate of the Democratic Party in the U.S. state of Colorado. Shad Murib serves as its chair.[2]
The governing body of the party is the State Central Committee, which consists of the chair and vice chair of the county Democratic Party in each of Colorado's 64 counties and "bonus" members for larger counties. In each odd-numbered year, county parties elect officers in February followed by the state party which elects its officers in March.
It is currently the dominant party in the state, controlling both of the state's U.S. Senate seats and all statewide executive offices, including the governorship. The Democrats also have a supermajority in the Colorado House of Representatives, and hold a majority of its U.S. House districts.
Responsibilities
[edit]The Colorado Democratic Party manages and oversees statewide coordinated campaigns and is responsible for arranging and staging the state convention in Presidential years and the state assembly every two years. The state convention selects delegates to the Democratic National Convention and Colorado's Presidential electors. The state's assemblies designate candidates for statewide, congressional, district attorneys, state legislative and county offices, including the offices of Governor, Attorney-General, Secretary of State, Treasurer, C.U. Regent At-Large, Board of Education Director At Large, and United States Senator. The party also adopts its platform at the state convention.
Current elected officials
[edit]Democrats hold all of the state's five statewide offices, a majority in the Colorado House of Representatives and a majority in the Colorado Senate. The party also holds both of the state's U.S. Senate seats and five of its eight U.S. House of Representatives seats.
Members of Congress
[edit]U.S. Senate
[edit]-
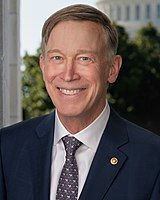
Junior U.S. Senator John Hickenlooper
-
Senior U.S. Senator Michael Bennet
U.S. House of Representatives
[edit]| District | Member | Photo |
|---|---|---|
| 1st | Diana DeGette |  |
| 2nd | Joe Neguse |  |
| 6th | Jason Crow |  |
| 7th | Brittany Pettersen |  |
| 8th | Yadira Caraveo |  |
Statewide offices
[edit]Legislative leadership
[edit]- President of the Senate: Steve Fenberg
- Senate Majority Leader: Robert Rodriguez
- Speaker of the House: Julie McCluskie
- House Majority Leader: Monica Duran
Municipal
[edit]The following Democrats hold prominent mayoralties in Colorado:
- Denver: Mike Johnston (1)
- Fort Collins: Jennifer Arndt (4)
- Boulder: Aaron Brockett
Election results
[edit]Presidential
[edit]Gubernatorial
[edit]| Election | Gubernatorial candidate | Votes | Vote % | Result |
|---|---|---|---|---|
| 1876 | Bela M. Hughes | 13,316 | 48.47% | Lost |
| 1878 | William A. H. Loveland | 11,535 | 40.30% | Lost |
| 1880 | John S. Hough | 23,547 | 44.08% | Lost |
| 1882 | James Benton Grant | 31,375 | 51.07% | Won |
| 1884 | Alva Adams | 30,743 | 46.09% | Lost |
| 1886 | Alva Adams | 29,234 | 49.66% | Won |
| 1888 | Thomas M. Patterson | 39,197 | 42.64% | Lost |
| 1890 | Caldwell Yeaman | 35,359 | 42.36% | Lost |
| 1892 | Joseph H. Maupin | 8,944 | 9.63% | Lost |
| 1894 | Charles S. Thomas | 8,337 | 4.63% | Lost |
| 1896 | Alva Adams | 87,387 | 46.22% | Won |
| 1898 | Charles S. Thomas | 93,966 | 62.89% | Won |
| 1900 | James Bradley Orman | 118,647 | 53.78% | Won |
| 1902 | E. C. Stimson | 80,727 | 43.21% | Lost |
| 1904 | Alva Adams | 123,092 | 50.64% | Won |
| 1906 | Alva Adams | 74,416 | 36.63% | Lost |
| 1908 | John F. Shafroth | 130,141 | 49.41% | Won |
| 1910 | John F. Shafroth | 114,676 | 51.04% | Won |
| 1912 | Elias M. Ammons | 114,044 | 42.91% | Won |
| 1914 | Thomas M. Patterson | 90,640 | 34.17% | Lost |
| 1916 | Julius Caldeen Gunter | 151,912 | 53.27% | Won |
| 1918 | Thomas J. Tynan | 102,397 | 46.47% | Lost |
| 1920 | James M. Collins | 108,738 | 37.11% | Lost |
| 1922 | William Ellery Sweet | 138,098 | 49.64% | Won |
| 1924 | William Ellery Sweet | 151,041 | 44.04% | Lost |
| 1926 | Billy Adams | 183,342 | 59.84% | Won |
| 1928 | Billy Adams | 240,160 | 67.05% | Won |
| 1930 | Billy Adams | 197,067 | 60.41% | Won |
| 1932 | Edwin C. Johnson | 257,188 | 57.23% | Won |
| 1934 | Edwin C. Johnson | 237,026 | 58.11% | Won |
| 1936 | Teller Ammons | 263,311 | 54.57% | Won |
| 1938 | Teller Ammons | 199,562 | 40.02% | Lost |
| 1940 | George E. Saunders | 245,292 | 44.96% | Lost |
| 1942 | Homer Bedford | 149,402 | 43.41% | Lost |
| 1944 | Roy Phelix Best | 236,086 | 47.60% | Lost |
| 1946 | William Lee Knous | 174,604 | 52.11% | Won |
| 1948 | William Lee Knous | 332,752 | 66.33% | Won |
| 1950 | Walter Walford Johnson | 212,976 | 47.22% | Lost |
| 1952 | John W. Metzger | 260,044 | 42.42% | Lost |
| 1954 | Edwin C. Johnson | 262,205 | 53.56% | Won |
| 1956 | Stephen McNichols | 331,283 | 51.34% | Won |
| 1958 | Stephen McNichols | 321,165 | 58.41% | Won |
| 1962 | Stephen McNichols | 262,890 | 42.64% | Lost |
| 1966 | Robert Lee Knous | 287,132 | 43.50% | Lost |
| 1970 | Mark Anthony Hogan | 302,432 | 45.24% | Lost |
| 1974 | Richard Lamm | 441,199 | 53.22% | Won |
| 1978 | Richard Lamm | 483,985 | 58.76% | Won |
| 1982 | Richard Lamm | 627,960 | 65.69% | Won |
| 1986 | Roy Romer | 616,325 | 58.20% | Won |
| 1990 | Roy Romer | 626,032 | 61.89% | Won |
| 1994 | Roy Romer | 619,205 | 55.47% | Won |
| 1998 | Gail Schoettler | 639,905 | 48.43% | Lost |
| 2002 | Rollie Heath | 475,373 | 33.65% | Lost |
| 2006 | Bill Ritter | 888,095 | 57.0% | Won |
| 2010 | John Hickenlooper | 915,436 | 51.1% | Won |
| 2014 | John Hickenlooper | 1,006,433 | 49.30% | Won |
| 2018 | Jared Polis | 1,348,888 | 53.42% | Won |
| 2022 | Jared Polis | 1,468,481 | 58.5% | Won |
See also
[edit]- Buie Seawell, former CDP chair
- Colorado Republican Party
- Political party strength in Colorado
- Politics of Colorado
- Elections in Colorado
- Government of Colorado
References
[edit]- ^ "Total Registered Voters By Party Affiliation".
- ^ Fish, Sandra (2023-04-01). "Shad Murib elected Colorado Democratic Party chairman in three-way contest". The Colorado Sun. Retrieved 2023-04-11.
Further reading
[edit]- Alan Ware (1979). "The End of Party Politics? Activist-Officeseeker Relationships in the Colorado Democratic Party". British Journal of Political Science. 9 (2): 237–250. doi:10.1017/S0007123400001745. JSTOR 193433. S2CID 154641763.
- Thomas E. Cronin; Robert D. Loevy (1993). Colorado Politics & Government: Governing the Centennial State. University of Nebraska Press. ISBN 0-8032-1451-0.
External links
[edit]- Colorado Democratic Party Archived 2021-04-12 at the Wayback Machine

