1986 Tasmanian state election
| |||||||||||||||||||||||||||||||||||||||||||||
All 35 seats to the House of Assembly 18 seats needed for a majority | |||||||||||||||||||||||||||||||||||||||||||||
|---|---|---|---|---|---|---|---|---|---|---|---|---|---|---|---|---|---|---|---|---|---|---|---|---|---|---|---|---|---|---|---|---|---|---|---|---|---|---|---|---|---|---|---|---|---|
| |||||||||||||||||||||||||||||||||||||||||||||
 Results of the election | |||||||||||||||||||||||||||||||||||||||||||||
| |||||||||||||||||||||||||||||||||||||||||||||
The 1986 Tasmanian state election was held on 8 February 1986 in the Australian state of Tasmania to elect 35 members of the Tasmanian House of Assembly. The election used the Hare-Clark proportional representation system[1] — seven members were elected from each of five electorates. The quota required for election was 12.5% in each division.
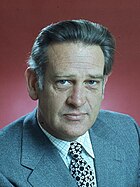
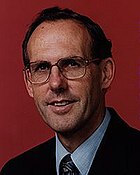
The incumbent Liberal government headed by Robin Gray hoped to secure a second term in office. The Labor Party was headed by Ken Wriedt. The Green independents were headed by Bob Brown. The Australian Democrats contested the electorates of Braddon and Bass. Green candidates contested the electorates of Denison and Franklin.
Prior to the election the Liberals held 18 of the 35 seats in parliament. The Labor Party held 14, and there were three independents—former Labor Premier Doug Lowe, Green independent Bob Brown, and ex-Liberal MHA Gabriel Haros.
Results
[edit]The representation of the Liberal and Labor parties remained unchanged after the election, at 19 and 14 respectively, leaving Robin Gray's Liberal government in power. It was the first time in 58 years that a non-Labor government had won a second term in Tasmania.
The Greens increased their representation from one to two, with Gerry Bates replacing independent Doug Lowe as the seventh member for the Division of Franklin (Lowe did not contest the election).
 | ||||||
|---|---|---|---|---|---|---|
| Party | Votes | % | +/– | Seats | +/– | |
| Liberal | 138,836 | 54.20 | +5.68 | 19 | ||
| Labor | 90,003 | 35.14 | -1.72 | 14 | ||
| Ind. Green | 14,227 | 5.55 | +3.84 | 2 | ||
| Independents | 6,385 | 2.49 | +0.50 | 0 | ||
| Democrats | 5,272 | 2.06 | -3.33 | 0 | ||
| Others | 1,438 | 0.56 | -4.97 | 0 | ||
| Total | 256,161 | 100.00 | – | 35 | – | |
| Valid votes | 256,161 | 94.07 | ||||
| Invalid/blank votes | 16,145 | 5.93 | +0.27 | |||
| Total votes | 272,306 | 100.00 | – | |||
| Registered voters/turnout | 290,277 | 93.81 | +0.34 | |||
Distribution of votes
[edit]Primary vote by division
[edit]| Bass | Braddon | Denison | Franklin | Lyons | |
|---|---|---|---|---|---|
| Labor Party | 37.4% | 34.1% | 30.8% | 36.5% | 36.9% |
| Liberal Party | 56.2% | 60.1% | 43.6% | 51.6% | 59.4% |
| Independent Greens | — | — | 15.9% | 11.9% | — |
| Other | 6.4% | 5.8% | 9.7% | — | 3.6% |
Distribution of seats
[edit]Aftermath
[edit]Shortly after the election, Ken Wreidt was replaced as Labor leader by Neil Batt.
See also
[edit]- Members of the Tasmanian House of Assembly, 1986–1989
- Candidates of the 1986 Tasmanian state election
- Results of the Tasmanian state election, 1986
References
[edit]- "House of Assembly Election Results 8 February 1986". Tasmanian Parliamentary Library.


