1985 Victorian state election
| |||||||||||||||||||||||||||||||||||||||||||||||||||||||||
All 88 seats in the Victorian Legislative Assembly and 22 (of the 44) seats in the Victorian Legislative Council 45 seats needed for a majority | |||||||||||||||||||||||||||||||||||||||||||||||||||||||||
|---|---|---|---|---|---|---|---|---|---|---|---|---|---|---|---|---|---|---|---|---|---|---|---|---|---|---|---|---|---|---|---|---|---|---|---|---|---|---|---|---|---|---|---|---|---|---|---|---|---|---|---|---|---|---|---|---|---|
| |||||||||||||||||||||||||||||||||||||||||||||||||||||||||
 Results in each electorate. | |||||||||||||||||||||||||||||||||||||||||||||||||||||||||
| |||||||||||||||||||||||||||||||||||||||||||||||||||||||||
The 1985 Victorian state election, held on Saturday, 2 March 1985, was for the 50th Parliament of Victoria. It was held in the Australian state of Victoria to elect all 88 members of the state's Legislative Assembly and 22 members of the 44-member Legislative Council. Since the previous election, the number of members of the Legislative Assembly was increased by 7 to 88.
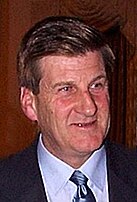
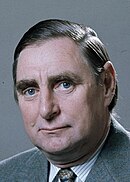
Lindsay Thompson, who led the Liberal Party to a defeat at the 1982 election with a 17-seat swing against it, resigned the leadership of the party on 5 November 1982. He was succeeded by Jeff Kennett. At the election, the incumbent Labor Party government led by John Cain Jr. maintained its electoral support, though the Liberal Party did increase the number of seats. It was the first time since Federation that a Labor government had been reelected in Victoria. Although the Labor Party lost seats in the lower house it gained a majority in the upper house picking up 4 seats to hold 23 up from 19 at the last election meaning the Liberal/National Coalition no longer had sway on government policy.
Results
[edit]Legislative Assembly
[edit]|
Victorian state election, 2 March 1985[1] | ||||||
|---|---|---|---|---|---|---|
| Enrolled voters | 2,641,477 | |||||
| Votes cast | 2,462,226 | Turnout | 93.21 | −0.76 | ||
| Informal votes | 66,107 | Informal | 2.68 | +0.07 | ||
| Summary of votes by party | ||||||
| Party | Primary votes | % | Swing | Seats | Change | |
| Labor | 1,198,262 | 50.01 | 0.00 | 47 | -2 | |
| Liberal | 1,003,003 | 41.86 | +3.53 | 31 | +7 | |
| National | 174,727 | 7.29 | +2.32 | 10 | +2 | |
| Independent | 12,828 | 0.54 | -0.51 | 0 | ±0 | |
| Weekend Trading | 3,909 | 0.16 | +0.16 | 0 | ±0 | |
| Public Transport | 3,390 | 0.14 | +0.14 | 0 | ±0 | |
| Total | 2,396,119 | 88 | ||||
| Two-party-preferred | ||||||
| Labor | 1,214,832 | 50.7 | –3.1 | |||
| Liberal | 1,181,287 | 49.3 | +3.1 | |||
Legislative Council
[edit]|
Victorian state election, 2 March 1985 | ||||||
|---|---|---|---|---|---|---|
| Enrolled voters | 2,641,477 | |||||
| Votes cast | 2,461,708 | Turnout | 93.19 | –0.67 | ||
| Informal votes | 74,202 | Informal | 3.01 | –0.12 | ||
| Summary of votes by party | ||||||
| Party | Primary votes | % | Swing | Seats won |
Seats held | |
| Labor | 1,128,747 | 47.28 | –2.28 | 11 | 23 | |
| Liberal | 982,418 | 41.15 | +1.94 | 8 | 16 | |
| National | 159,299 | 6.67 | +1.17 | 3 | 5 | |
| Democrats | 95,045 | 3.98 | –1.05 | 0 | 0 | |
| Call to Australia | 16,849 | 0.71 | +0.71 | 0 | 0 | |
| Independent | 5,148 | 0.22 | +0.04 | 0 | 0 | |
| Total | 2,387,506 | 22 | 44 | |||
Seats changing hands
[edit]| Seat | Pre-1985 | Swing | Post-1985 | ||||||
|---|---|---|---|---|---|---|---|---|---|
| Party | Member | Margin | Margin | Member | Party | ||||
| Bennettswood | Labor | Doug Newton | 1.2 | -2.0 | 0.8 | Roger Pescott | Liberal | ||
| Dromana | Labor | David Hassett | 1.4 | -3.8 | 2.4 | Ron Wells | Liberal | ||
| Evelyn | Labor | Max McDonald | 1.3 | -4.1 | 2.8 | Jim Plowman | Liberal | ||
| Ivanhoe | Labor | Tony Sheehan | 1.3 | -2.7 | 1.6 | Vin Heffernan | Liberal | ||
| Mornington | Labor | notional - new seat | 1.4 | -3.4 | 2.0 | Robin Cooper | Liberal | ||
| Syndal | Labor | David Gray | 0.1 | -1.5 | 1.4 | Geoff Coleman | Liberal | ||
| Warrnambool | Liberal | Adam Kempton | 11.3 | -17.8 | 6.5 | John McGrath | National | ||
- Members listed in italics did not recontest their seats.
- In addition, the National party retained the seat of Swan Hill, which it had won from the Liberals in a by-election.
Redistribution affected seats
[edit]| Seat | 1982 election | 1984 redistribution | Swing | 1985 election | |||||||||
| Party | Member | Margin | Party | Member | Margin | Margin | Member | Party | |||||
| Mentone | Liberal | Bill Templeton | 1.2 | Labor | Notional | 3.7 | -1.7 | 2.0 | Peter Spyker | Labor | |||
| Narracan | Liberal | John Delzoppo | 1.7 | Labor | Notional | 1.4 | 1.8 | 0.4 | John Delzoppo | Liberal | |||
| Prahran | Labor | Bob Miller | 3.7 | Liberal | Notional | 1.7 | 5.1 | 6.8 | Don Hayward | Liberal | |||
| Sandringham | Labor | Graham Ihlein | 1.5 | Liberal | Notional | 2.6 | 2.3 | 4.9 | David Lea | Liberal | |||
Post-election pendulum
[edit]See also
[edit]References
[edit]- ^ "Election held on 2 March 1985". Australian Politics and Elections Database. University of Western Australia.


