1956 Puerto Rican general election
Appearance
(Redirected from United States House of Representatives election in Puerto Rico, 1956)
| |||||||||||||||||||||
|
| |||||||||||||||||||||
Gubernatorial election | |||||||||||||||||||||
| Turnout | 80.37% | ||||||||||||||||||||
|---|---|---|---|---|---|---|---|---|---|---|---|---|---|---|---|---|---|---|---|---|---|
| |||||||||||||||||||||
 Results by municipality Muñoz: 40-50% 50-60% 60-70% 70-80% 80-90% | |||||||||||||||||||||
| |||||||||||||||||||||
Resident Commissioner election | |||||||||||||||||||||
| |||||||||||||||||||||
 |
|---|
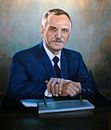
General elections were held in Puerto Rico on November 6, 1956.[1] Luis Muñoz Marín of the Popular Democratic Party (PPD) was re-elected as governor, whilst the PPD also won a majority of seats in the legislative elections. Voter turnout was 80%.[2][3]
Results
[edit]Governor
[edit]| Candidate | Party | Votes | % | |
|---|---|---|---|---|
| Luis Muñoz Marín | Popular Democratic Party | 435,255 | 62.49 | |
| Luis A. Ferré | Partido Estadista Republicano | 174,683 | 25.08 | |
| Francisco Susoni | Puerto Rican Independence Party | 86,636 | 12.44 | |
| Total | 696,574 | 100.00 | ||
| Valid votes | 696,574 | 99.26 | ||
| Invalid/blank votes | 5,164 | 0.74 | ||
| Total votes | 701,738 | 100.00 | ||
| Registered voters/turnout | 873,085 | 80.37 | ||
| Source: Nohlen | ||||
Resident Commissioner
[edit]| Candidate | Party | Votes | % | |
|---|---|---|---|---|
| Antonio Fernós-Isern | Popular Democratic Party | 434,256 | 62.51 | |
| Antonio Ortíz Toro | Partido Estadista Republicano | 173,580 | 24.99 | |
| Marco A. Ramírez | Puerto Rican Independence Party | 86,886 | 12.51 | |
| Total | 694,722 | 100.00 | ||
| Source: Nolla | ||||
Senate
[edit]| Party | District class I | District class II | At-large | Total seats | |||||||
|---|---|---|---|---|---|---|---|---|---|---|---|
| Votes | % | Seats | Votes | % | Seats | Votes | % | Seats | |||
| Popular Democratic Party | 434,123 | 62.51 | 8 | 434,030 | 62.52 | 8 | 434,109 | 62.54 | 7 | 23 | |
| Partido Estadista Republicano | 173,472 | 24.98 | 0 | 173,419 | 24.98 | 0 | 173,240 | 24.96 | 3 | 3 | |
| Puerto Rican Independence Party | 86,839 | 12.51 | 0 | 86,751 | 12.50 | 0 | 86,789 | 12.50 | 3 | 3 | |
| Total | 694,434 | 100.00 | 8 | 694,200 | 100.00 | 8 | 694,138 | 100.00 | 13 | 29 | |
| Source: Nolla | |||||||||||
House of Representatives
[edit]| Party | District | At-large | Total seats | |||||
|---|---|---|---|---|---|---|---|---|
| Votes | % | Seats | Votes | % | Seats | |||
| Popular Democratic Party | 432,397 | 62.43 | 40 | 434,463 | 63.46 | 7 | 47 | |
| Partido Estadista Republicano | 172,639 | 24.93 | 0 | 173,275 | 25.31 | 3 | 3 | |
| Puerto Rican Independence Party | 87,546 | 12.64 | 0 | 76,903 | 11.23 | 6 | 6 | |
| Total | 692,582 | 100.00 | 40 | 684,641 | 100.00 | 16 | 56 | |
| Source: Nolla | ||||||||
References
[edit]- ^ Dieter Nohlen (2005) Elections in the Americas: A data handbook, Volume I, p552 ISBN 978-0-19-928357-6
- ^ Nohlen, p557
- ^ Nohlen, p563


