1970 United States census
| Nineteenth census of the United States | ||
|---|---|---|
| ||
 U.S. Census Bureau seal | ||
 1970 U.S. census logo | ||
| General information | ||
| Country | United States | |
| Results | ||
| Total population | 203,392,031 ( | |
| Most populous | California 19,953,134 | |
| Least populous | Alaska 302,173 | |
The 1970 United States census, conducted by the Census Bureau, determined the resident population of the United States to be 203,392,031, an increase of 13.4 percent over the 179,323,175 persons enumerated during the 1960 census.
This was the first census since 1820 in which New York was not the most populous state—California overtook it in population in January 1963. This was also the first census in which all states recorded a population of over 300,000, and the first in which a city in the geographic South—Houston—recorded a population of over 1 million.

Data availability
[edit]Microdata from the 1970 census are freely available through the Integrated Public Use Microdata Series. Aggregate data for small areas, together with electronic boundary files, can be downloaded from the National Historical Geographic Information System. These data were originally created and disseminated by DUALabs. Personally identifiable information will be available in 2042.[1]
State rankings
[edit]| Rank | State | Population as of 1970 census |
Population as of 1960 census |
Change | Percent change |
|---|---|---|---|---|---|
| 1 | 19,953,134 | 15,717,204 | 4,235,930 |
27.0% | |
| 2 | 18,236,967 | 16,782,304 | 1,454,663 |
8.7% | |
| 3 | 11,793,909 | 11,319,366 | 474,543 |
4.2% | |
| 4 | 11,196,730 | 9,579,677 | 1,617,053 |
16.9% | |
| 5 | 11,113,976 | 10,081,158 | 1,032,818 |
10.2% | |
| 6 | 10,652,017 | 9,706,397 | 945,620 |
9.7% | |
| 7 | 8,875,083 | 7,823,194 | 1,051,889 |
13.4% | |
| 8 | 7,168,164 | 6,066,782 | 1,101,382 |
18.2% | |
| 9 | 6,789,443 | 4,951,560 | 1,837,883 |
37.1% | |
| 10 | 5,689,170 | 5,148,578 | 540,592 |
10.5% | |
| 11 | 5,193,669 | 4,662,498 | 531,171 |
11.4% | |
| 12 | 5,082,059 | 4,556,155 | 525,904 |
11.5% | |
| 13 | 4,676,501 | 4,319,813 | 356,688 |
8.3% | |
| 14 | 4,648,494 | 3,966,949 | 681,545 |
17.2% | |
| 15 | 4,589,575 | 3,943,116 | 646,459 |
16.4% | |
| 16 | 4,417,731 | 3,951,777 | 465,954 |
11.8% | |
| 17 | 3,923,687 | 3,567,089 | 356,598 |
10.0% | |
| 18 | 3,922,399 | 3,100,689 | 821,710 |
26.5% | |
| 19 | 3,804,971 | 3,413,864 | 391,107 |
11.5% | |
| 20 | 3,641,306 | 3,257,022 | 384,284 |
11.8% | |
| 21 | 3,444,165 | 3,266,740 | 177,425 |
5.4% | |
| 22 | 3,409,169 | 2,853,214 | 555,955 |
19.5% | |
| 23 | 3,218,706 | 3,038,156 | 180,550 |
5.9% | |
| 24 | 3,031,709 | 2,535,234 | 496,475 |
19.6% | |
| 25 | 2,824,376 | 2,757,537 | 66,839 |
2.4% | |
| 26 | 2,590,516 | 2,382,594 | 207,922 |
8.7% | |
| 27 | 2,559,229 | 2,328,284 | 230,945 |
9.9% | |
| 28 | 2,246,578 | 2,178,611 | 67,967 |
3.1% | |
| 29 | 2,216,912 | 2,178,141 | 38,771 |
1.8% | |
| 30 | 2,207,259 | 1,753,947 | 453,312 |
25.8% | |
| 31 | 2,091,533 | 1,768,687 | 322,846 |
18.3% | |
| 32 | 1,923,295 | 1,786,272 | 137,023 |
7.7% | |
| 33 | 1,745,944 | 1,302,161 | 443,783 |
34.1% | |
| 34 | 1,744,237 | 1,860,421 | -116,184 |
-6.2% | |
| 35 | 1,483,493 | 1,411,330 | 72,163 |
5.1% | |
| 36 | 1,059,273 | 890,627 | 168,646 |
18.9% | |
| 37 | 1,017,055 | 951,023 | 66,032 |
6.9% | |
| 38 | 992,048 | 969,265 | 22,783 |
2.4% | |
| 39 | 946,725 | 859,488 | 87,237 |
10.1% | |
| 40 | 769,913 | 632,772 | 137,141 |
21.7% | |
| – | 756,510 | 763,956 | -7,446 |
-1.0% | |
| 41 | 737,681 | 606,921 | 130,760 |
21.5% | |
| 42 | 712,567 | 667,191 | 45,376 |
6.8% | |
| 43 | 694,409 | 674,767 | 19,642 |
2.9% | |
| 44 | 665,507 | 680,514 | -15,007 |
-2.2% | |
| 45 | 617,761 | 632,446 | -14,685 |
-2.3% | |
| 46 | 548,104 | 446,292 | 101,812 |
22.8% | |
| 47 | 488,738 | 285,278 | 203,460 |
71.3% | |
| 48 | 444,330 | 389,881 | 54,449 |
14.0% | |
| 49 | 332,416 | 330,066 | 2,350 |
0.7% | |
| 50 | 300,382 | 226,167 | 74,215 |
32.8% |
City rankings
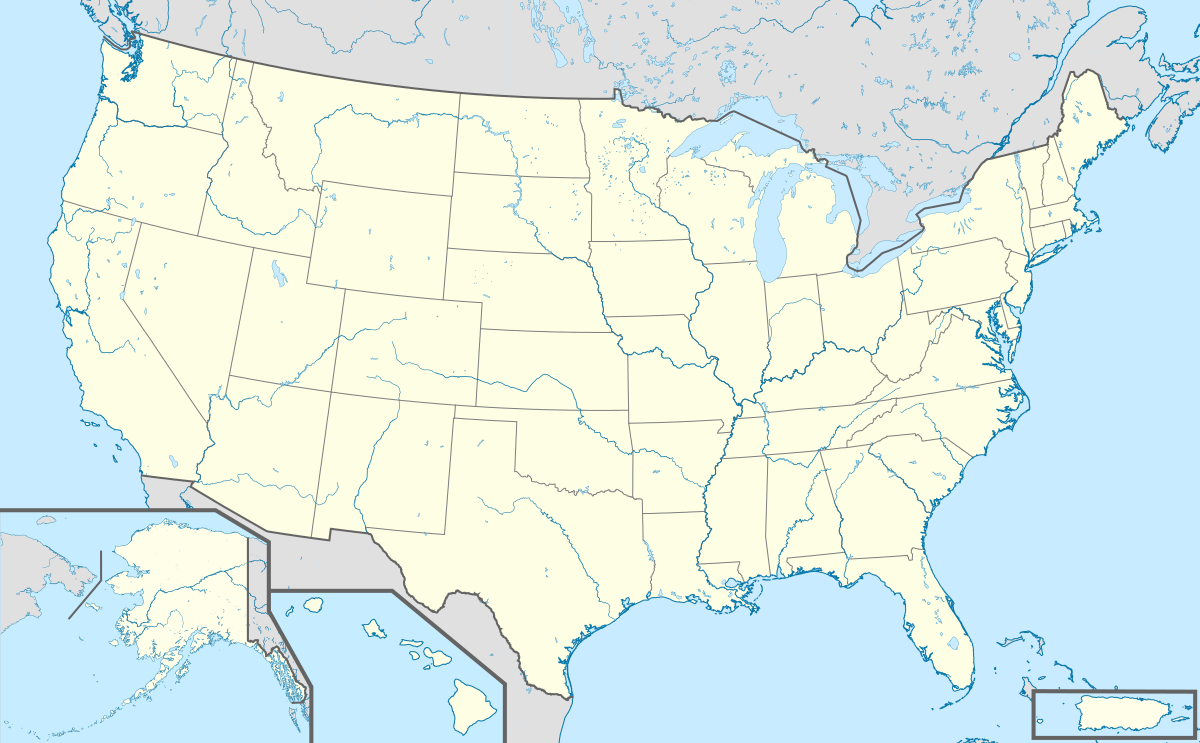
[edit]Locations of 50 most populous cities
[edit]Conclusions
[edit]California took over as the most populous state; New York had previously been ranked number one. While the entire country increased to more than 204 million persons, four states lost population, with West Virginia leading the list, down roughly 7 percent from 1960.[4]
Notes
[edit]- ^ "The "72-Year Rule" – History". U.S. Census Bureau. Archived from the original on October 4, 2015. Retrieved October 26, 2013.
- ^ Gibson, Campbell (June 1998), Population of the 100 Largest Cities and Other Urban Places in the United States: 1790 to 1990, U.S. Census Bureau, archived from the original on September 2, 2017
- ^ "Regions and Divisions". U.S. Census Bureau. Archived from the original on December 3, 2016. Retrieved September 9, 2014.
- ^ http://www.upi.com/Audio/Year_in_Review/Events-of-1970/Apollo-13/12303235577467-2/#title "1970 Year in Review, UPI.com". Accessed April 8, 2009. Archived May 4, 2009.

