Portal:Climate change
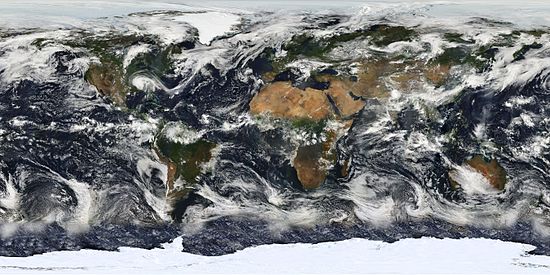
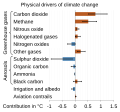
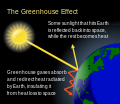
The Climate Change Portal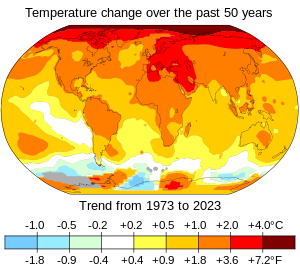 Present-day climate change includes both global warming—the ongoing increase in global average temperature—and its wider effects on Earth’s climate system. Climate change in a broader sense also includes previous long-term changes to Earth's climate. The current rise in global temperatures is driven by human activities, especially fossil fuel burning since the Industrial Revolution. Fossil fuel use, deforestation, and some agricultural and industrial practices release greenhouse gases. These gases absorb some of the heat that the Earth radiates after it warms from sunlight, warming the lower atmosphere. Carbon dioxide, the primary gas driving global warming, has increased in concentration by about 50% since the pre-industrial era to levels not seen for millions of years. Climate change has an increasingly large impact on the environment. Deserts are expanding, while heat waves and wildfires are becoming more common. Amplified warming in the Arctic has contributed to thawing permafrost, retreat of glaciers and sea ice decline. Higher temperatures are also causing more intense storms, droughts, and other weather extremes. Rapid environmental change in mountains, coral reefs, and the Arctic is forcing many species to relocate or become extinct. Even if efforts to minimize future warming are successful, some effects will continue for centuries. These include ocean heating, ocean acidification and sea level rise. Climate change threatens people with increased flooding, extreme heat, increased food and water scarcity, more disease, and economic loss. Human migration and conflict can also be a result. The World Health Organization calls climate change one of the biggest threats to global health in the 21st century. Societies and ecosystems will experience more severe risks without action to limit warming. Adapting to climate change through efforts like flood control measures or drought-resistant crops partially reduces climate change risks, although some limits to adaptation have already been reached. Poorer communities are responsible for a small share of global emissions, yet have the least ability to adapt and are most vulnerable to climate change. Many climate change impacts have been observed in the first decades of the 21st century, with 2024 the warmest on record at +1.60 °C (2.88 °F) since regular tracking began in 1850. Additional warming will increase these impacts and can trigger tipping points, such as melting all of the Greenland ice sheet. Under the 2015 Paris Agreement, nations collectively agreed to keep warming "well under 2 °C". However, with pledges made under the Agreement, global warming would still reach about 2.8 °C (5.0 °F) by the end of the century. Limiting warming to 1.5 °C would require halving emissions by 2030 and achieving net-zero emissions by 2050. Fossil fuel use can be phased out by conserving energy and switching to energy sources that do not produce significant carbon pollution. These energy sources include wind, solar, hydro, and nuclear power. Cleanly generated electricity can replace fossil fuels for powering transportation, heating buildings, and running industrial processes. Carbon can also be removed from the atmosphere, for instance by increasing forest cover and farming with methods that capture carbon in soil. (Full article...) Selected article – Global surface temperature (GST) is the average temperature of Earth's surface. More precisely, it is the weighted average of the temperatures over the ocean and land. The former is also called sea surface temperature and the latter is called surface air temperature. Temperature data comes mainly from weather stations and satellites. To estimate data in the distant past, proxy data can be used for example from tree rings, corals, and ice cores. Observing the rising GST over time is one of the many lines of evidence supporting the scientific consensus on climate change, which is that human activities are causing climate change. Alternative terms for the same thing are global mean surface temperature (GMST) or global average surface temperature. Series of reliable temperature measurements in some regions began in the 1850—1880 time frame (this is called the instrumental temperature record). The longest-running temperature record is the Central England temperature data series, which starts in 1659. The longest-running quasi-global records start in 1850. For temperature measurements in the upper atmosphere a variety of methods can be used. This includes radiosondes launched using weather balloons, a variety of satellites, and aircraft. Satellites can monitor temperatures in the upper atmosphere but are not commonly used to measure temperature change at the surface. Ocean temperatures at different depths are measured to add to global surface temperature datasets. This data is also used to calculate the ocean heat content. Through 1940, the average annual temperature increased, but was relatively stable between 1940 and 1975. Since 1975, it has increased by roughly 0.15 °C to 0.20 °C per decade, to at least 1.1 °C (1.9 °F) above 1880 levels. The current annual GMST is about 15 °C (59 °F), though monthly temperatures can vary almost 2 °C (4 °F) above or below this figure. (Full article...) Selected picture –Image: Marit Jentoft-Nilsen, NASA An image of the Earth's cloud cover, which is the amount of sky obscured by clouds, based largely on observations from NASA's Moderate Resolution Imaging Spectroradiometer (MODIS) on board the Terra satellite. Clouds play multiple critical roles in the climate system. In particular, being bright objects in the visible part of sunlight, they efficiently reflect light to space and thus contribute to the cooling of the planet.
WikiProjectsIn the newsAdditional News
Selected biography –Maria Osmarina Marina da Silva Vaz de Lima (born Maria Osmarina da Silva; 8 February 1958), known as Marina Silva, is a Brazilian politician and environmentalist, currently serving as Minister of the Environment and Climate Change, a position she previously held from 2003 to 2008. She is the founder and former spokeswoman of the Sustainability Network (REDE). A former senator for the state of Acre between 1995 and 2011, she has been a federal deputy for the state of São Paulo since 2023. She ran unsuccessfully for president in 2010, 2014 and 2018. Silva was a member of the PT until 2009, and served as a senator before becoming Minister of the Environment in 2003. She ran for president in the 2010 Brazilian elections as the candidate for the Green Party, coming in 3rd with 19% of the first-round vote. In April 2014, Eduardo Campos announced his candidacy for the fall 2014 presidential election, naming Marina Silva as his vice presidential candidate. After Campos's death in a plane crash on August, she was selected to run as the Socialist Party's candidate for the presidency, winning 21% of the vote and coming in 3rd. She again ran for president in the 2018 election, this time as the nominee for the Sustainability Network, finishing in 8th place with 1% of the vote. Silva has won a number of awards from US and international organizations in recognition of her environmental activism. In 2010, she, along with Cécile Duflot, Monica Frassoni, Elizabeth May and Renate Künast, were named by Foreign Policy magazine to its list of top global thinkers for taking Green mainstream. She was one of eight people chosen to carry the Olympic flag for the opening ceremonies of the 2012 London Summer Olympics. (Full article...) General imagesThe following are images from various climate-related articles on Wikipedia.
Did you know –Related portalsSelected panorama – Credit: Created by Robert A. Rohde from data published by the U.S. NOAA Earth System Research Laboratory, Global Monitoring Division The Global Historical Climatology Network (GHCN) is one of the primary reference compilations of temperature data used for climatology, and is the foundation of the GISTEMP Temperature Record. This map shows the 7,280 fixed temperature stations in the GHCN catalog color coded by the length of the available record. Sites that are actively updated in the database (2,277) are marked as "active" and shown in large symbols, other sites are marked as "historical" and shown in small symbols. In some cases, the "historical" sites are still collecting data but due to reporting and data processing delays (of more than a decade in some cases) they do not contribute to current temperature estimates.
As is evident from this plot, the most densely instrumented portion of the globe is in the United States, while Antarctica is the most sparsely instrumented land area. Parts of the Pacific and other oceans are more isolated from fixed temperature stations, but this is supplemented by volunteer observing ships that record temperature information during their normal travels. This image shows 3,832 records longer than 50 years, 1,656 records longer than 100 years, and 226 records longer than 150 years. The longest record in the collection began in Berlin in 1701 and is still collected in the present day.
Topics
CategoriesWeb resources
Things to do
WikimediaReferences
Discover Wikipedia using portals
|

