List of costliest tropical cyclones
This is a list of costliest tropical cyclones, listed by tropical cyclone basin. Damage tolls of tropical cyclones are listed in USD of the year of the tropical cyclone. The main effects of tropical cyclones include strong winds, heavy rainfall, storm surge, floods, tornadoes, and landslides.[1] This list is based on property damage done directly by a tropical cyclone.
Overall costliest
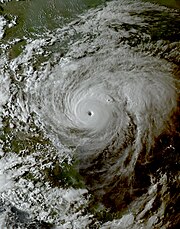
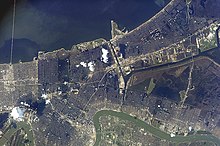
[edit]The costliest tropical cyclones on record are Hurricanes Katrina and Harvey, both causing $125 billion in damages in 2005 and 2017 respectively. In 2022, Hurricane Ian became the third costliest tropical cyclone on record.[2][3][4][5] In 2017, Hurricane Maria became the fourth costliest tropical cyclone on record. In 2024, Hurricane Helene became the fifth most costly tropical cyclone on record. Hurricanes Irma and Ida also have damage tolls of over $70 billion.[6][7][8]
| Costliest Tropical Cyclones | |||||||||
|---|---|---|---|---|---|---|---|---|---|
| Rank | Storm Name | Season | Basin | Damage | Rank | Storm Name | Season | Basin | Damage |
| 1 | 5 Katrina | 2005 | N. Atlantic | $125 billion | 26 | 3 Irene | 2011 | N. Atlantic | $14.2 billion |
| 4 Harvey | 2017 | 27 | 5 Jebi | 2018 | W. Pacific | $13.0 billion | |||
| 3 | 5 Ian | 2022 | $113 billion | 28 | 5 Otis | 2023 | E. Pacific | $12.0 billion | |
| 4 | 5 Maria | 2017 | $91.6 billion | 29 | 5 Hugo | 1989 | N. Atlantic | $11.0 billion | |
| 5 | 4 Helene | 2024 | $78.7 billion[note 1] | 30 | 2 Fitow | 2013 | W. Pacific | $10.4 billion | |
| 6 | 5 Irma | 2017 | $77.2 billion | 31 | 4 Frances | 2004 | N. Atlantic | $10.1 billion | |
| 7 | 4 Ida | 2021 | $75.3 billion | 32 | 4 Mireille | 1991 | W. Pacific | $10.0 billion | |
| 8 | 3 Sandy | 2012 | $68.7 billion | 4 Faxai | 2019 | ||||
| 9 | 4 Ike | 2008 | $38.0 billion | 34 | 4 Georges | 1998 | N. Atlantic | $9.37 billion | |
| 10 | 5 Milton | 2024 | $34.3 billion[note 2] | 35 | 4 Songda | 2004 | W. Pacific | $9.30 billion | |
| 11 | 4 Doksuri | 2023 | W. Pacific | $28.5 billion | 36 | 4 Lekima | 2019 | $9.28 billion | |
| 12 | 5 Andrew | 1992 | N. Atlantic | $27.3 billion | 37 | 5 Saomai | 2000 | $9.24 billion | |
| 13 | 5 Wilma | 2005 | $26.5 billion | 38 | 2 Gabrielle | 2022–23 | S. Pacific | $9.20 billion | |
| 14 | 5 Ivan | 2004 | $26.1 billion | 39 | TS Allison | 2001 | N. Atlantic | $9.00 billion | |
| 15 | 5 Michael | 2018 | $25.5 billion | 40 | 5 Beryl | 2024 | $8.32 billion | ||
| 16 | 4 Florence | 2018 | $24.2 billion | 41 | 4 Gustav | 2008 | $8.31 billion | ||
| 17 | 4 Laura | 2020 | $23.3 billion | 42 | 5 Fani | 2019 | N. Indian | $8.10 billion | |
| 18 | TS Daniel | 2023 | Mediterranean | $21.1 billion | 43 | 5 Rammasun | 2014 | W. Pacific | $8.08 billion |
| 19 | 5 Rita | 2005 | N. Atlantic | $18.5 billion | 44 | 3 Jeanne | 2004 | N. Atlantic | $7.94 billion |
| 20 | 5 Hagibis | 2019 | W. Pacific | $17.3 billion | 45 | 2 Sally | 2020 | $7.30 billion | |
| 21 | 4 Charley | 2004 | N. Atlantic | $16.9 billion | 46 | 4 Eta | 2020 | $7.24 billion | |
| 22 | 5 Matthew | 2016 | $16.5 billion | 47 | 4 Floyd | 1999 | $6.50 billion | ||
| 23 | 5 Amphan | 2020 | N. Indian | $15.5 billion | 48 | 3 Hato | 2017 | W. Pacific | $6.41 billion |
| 24 | 4 Nargis | 2008 | $15.3 billion | 49 | 1 Morakot | 2009 | $6.20 billion | ||
| 25 | 5 Yagi | 2024 | W. Pacific | $15.1 billion | 50 | 5 Mitch | 1998 | N. Atlantic | $6.08 billion |
North Atlantic Ocean
[edit]The costliest Atlantic hurricanes on record are Hurricanes Katrina and Harvey, both causing $125 billion in damages in 2005 and 2017 respectively. In 2022, Hurricane Ian became the third costliest Atlantic hurricane on record.[2][3][4][5] Hurricanes Maria, Helene, Irma, and Ida also have damage tolls of over $70 billion.[6][7][8] The costliest tropical cyclone in the Atlantic that did not become a hurricane is Tropical Storm Allison, which caused $9 billion in damages in 2001.[9] The costliest Atlantic hurricane to not have its name retired is Hurricane Sally in 2020, which caused $7.3 billion in damages.[10]
| Costliest Atlantic hurricanes | |||
|---|---|---|---|
| Rank | Hurricane | Season | Damage |
| 1 | 5 Katrina | 2005 | $125 billion |
| 4 Harvey | 2017 | ||
| 3 | 5 Ian | 2022 | $113 billion |
| 4 | 5 Maria | 2017 | $91.6 billion |
| 5 | 4 Helene | 2024 | $78.7 billion[note 3] |
| 6 | 5 Irma | 2017 | $77.2 billion |
| 7 | 4 Ida | 2021 | $75.3 billion |
| 8 | 3 Sandy | 2012 | $68.7 billion |
| 9 | 4 Ike | 2008 | $38 billion |
| 10 | 5 Milton | 2024 | $34.3 billion[note 4] |
Northeastern Pacific Ocean
[edit]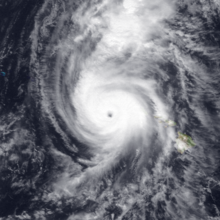
The costliest Pacific hurricane on record was Hurricane Otis in 2023.[11] Hurricane Manuel in 2013 is the second costliest Pacific hurricane on record.[12] Hurricane Iniki of the 1992 Pacific hurricane season is still the costliest central Pacific hurricane on record.[13] Only six Pacific hurricanes have caused over one billion dollars in damage; the three mentioned above, as well as Hurricane John, Hurricane Odile and Tropical Storm Agatha.[14][15][16]
| Costliest Pacific hurricanes | |||
|---|---|---|---|
| Rank | Hurricane | Season | Damage |
| 1 | 5 Otis | 2023 | $12 billion |
| 2 | 1 Manuel | 2013 | $4.2 billion |
| 3 | 4 Iniki | 1992 | $3.1 billion |
| 4 | 3 John | 2024 | $2.5 billion |
| 5 | 4 Odile | 2014 | $1.25 billion |
| 6 | TS Agatha | 2010 | $1.1 billion |
| 7 | 4 Hilary | 2023 | $915 million |
| 8 | 5 Willa | 2018 | $825 million |
| 9 | 1 Madeline | 1998 | $750 million |
| 10 | 2 Rosa | 1994 | $700 million |
Northwestern Pacific Ocean
[edit]The costliest typhoon on record was Typhoon Doksuri in 2023, which caused over $28 billion in damages, primarily in China.[17][18][19] Typhoon Hagibis in 2019 was responsible for over $17 billion in damages.[20] Typhoon Yagi in 2024 is the third-costliest in nominal terms, causing over $15 billion in damages, while Typhoon Jebi in 2018 is the fourth-costliest, causing $13 billion in damages. Adjusting for inflation, Typhoon Mireille of 1991 is the second-costliest typhoon on record with it causing $18.4 billion (2018 USD) in damages.[21] Without adjusting for inflation, it is tied with Typhoon Faxai of 2019 with both systems causing $10 billion in damages.[22][23] Typhoons Lekima, Songda, and Saomai caused over $9 billion in damages in 2019, 2004, and 2000, respectively.[24][23]
| Costliest Pacific typhoons | |||
|---|---|---|---|
| Rank | Typhoon | Season | Damage |
| 1 | 4 Doksuri | 2023 | $28.5 billion |
| 2 | 5 Hagibis | 2019 | $17.3 billion |
| 3 | 5 Yagi | 2024 | $15.1 billion |
| 4 | 5 Jebi | 2018 | $13 billion |
| 5 | 2 Fitow | 2013 | $10.4 billion |
| 6 | 4 Mireille | 1991 | $10 billion |
| 4 Faxai | 2019 | ||
| 8 | 4 Songda | 2004 | $9.3 billion |
| 9 | 4 Lekima | 2019 | $9.28 billion |
| 10 | 5 Saomai | 2000 | $9.24 billion |
North Indian Ocean
[edit]The costliest North Indian Ocean cyclone on record was Cyclone Amphan in 2020, which caused $15.5 billion in damages.[25] Cyclone Nargis became the second costliest cyclone in 2008 after causing $15.3 billion in damages.[26] Cyclone Gonu is the costliest tropical cyclone in the Arabian Sea.[27] Other costly cyclones include Cyclones Fani, the 1999 Odisha cyclone, and Cyclone Phailin.[28][29][30]
| Costliest North Indian Ocean tropical cyclones | |||
|---|---|---|---|
| Rank | Tropical cyclones | Season | Damage |
| 1 | 5 Amphan | 2020 | $15.5 billion |
| 2 | 4 Nargis | 2008 | $15.3 billion |
| 3 | 5 Fani | 2019 | $8.1 billion |
| 4 | 5 "Odisha" | 1999 | $4.44 billion |
| 5 | 5 Gonu | 2007 | $4.42 billion |
| 6 | 5 Phailin | 2013 | $4.26 billion |
| 7 | 4 Hudhud | 2014 | $3.58 billion |
| 8 | 3 Bulbul | 2019 | $3.41 billion |
| 9 | 2 Vardah | 2016 | $3.38 billion |
| 10 | 3 "Gujarat" | 1998 | $3 billion |
South-West Indian Ocean
[edit]Only five South-West Indian Ocean tropical cyclones are known to have caused at least $400 million in damages. Among these, the costliest on record was Cyclone Chido in 2024, which caused $3.9 billion in damages.[31] The other four cyclones are, Idai in 2019, Issa in 2022, Freddy in 2023, Enawo in 2017; respectively, the four cyclones caused $3.3 billion, $1.57 billion, $1.53 billion, $400 million.[32][33][34][35][36][37]
| Costliest South-West Indian Ocean tropical cyclones | |||
|---|---|---|---|
| Rank | Tropical cyclones | Season | Damage |
| 1 | 4 Chido | 2024–25 | $3.9 billion |
| 2 | 4 Idai | 2018–19 | $3.3 billion |
| 3 | SD Issa | 2021–22 | $1.57 billion |
| 4 | 5 Freddy | 2022–23 | $1.53 billion |
| 5 | 4 Enawo | 2016–17 | $400 million |
| 6 | 4 Kenneth | 2018–19 | $345 million |
| 7 | 4 Leon–Eline | 1999–00 | $309 million |
| 8 | 4 Dina | 2001–02 | $287 million |
| 9 | 3 Kamisy | 1983–84 | $250 million |
| 5 Gafilo | 2003–04 | ||
Australian region
[edit]
The costliest Australian region tropical cyclone on record was Cyclone Yasi in 2011, which caused $3.6 billion in damages.[38] The next costliest cyclone, Debbie, caused $2.73 billion in damages[39] and is closely followed by Oswald which caused $2.52 billion in damages.[40] Additionally, Cyclones Veronica, Ita, and Larry caused over $1 billion in damages in 2019, 2014, and 2006 respectively.[41][42][43][44][45] Cyclone Tracy is considered one of Australia's most destructive cyclones. While only causing $645 million in damages,[note 5][46] 66 people were killed and over 25,000 people were left homeless.[47]
| Costliest Australian region tropical cyclones | |||
|---|---|---|---|
| Rank | Tropical cyclones | Season | Damage |
| 1 | 4 Yasi | 2010–11 | $3.6 billion |
| 2 | 4 Debbie | 2016–17 | $2.73 billion |
| 3 | TS Oswald | 2012–13 | $2.52 billion |
| 4 | 4 Veronica | 2018–19 | $1.2 billion |
| 5 | 5 Ita | 2013–14 | $1.15 billion |
| 6 | 4 Larry | 2005–06 | $1.1 billion |
| 7 | 4 Jasper | 2023–24 | $670 million |
| 8 | 3 Tracy | 1974–75 | $645 million |
| 9 | 5 Marcia | 2014–15 | $587 million |
| 10 | 3 Rusty | 2012–13 | $510 million |
South Pacific Ocean
[edit]The costliest South Pacific tropical cyclone was Cyclone Gabrielle in 2023, which caused $9.2 billion in damages.[48] The next costliest, Tropical Depression 06F in 2023, caused $1.43 billion in damages.[49] Other costly South Pacific cyclones include Cyclone Winston in 2016[50] and Cyclone Pam in 2015.[51][52]
| Costliest South Pacific Ocean tropical cyclones | |||
|---|---|---|---|
| Rank | Tropical cyclones | Season | Damage |
| 1 | 2 Gabrielle | 2022–23 | $9.2 billion |
| 2 | TD 06F | 2022–23 | $1.43 billion |
| 3 | 5 Winston | 2015–16 | $1.4 billion |
| 4 | 5 Pam | 2014–15 | $692 million |
| 5 | 4 Kevin | 2022–23 | $433 million |
| 6 | 4 Evan | 2012–13 | $313 million |
| 7 | 4 Gita | 2017–18 | $253 million |
| 8 | 5 Niran | 2020–21 | $250 million |
| 9 | 5 Yasa | 2020–21 | $247 million |
| 10 | 4 Ofa | 1989–90 | $188 million |
Mediterranean Sea
[edit]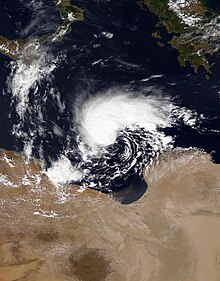
The costliest Mediterranean tropical-like cyclone is Storm Daniel in 2023, which caused $21.14 billion in damages in Greece and Libya.[54][55] The next costliest is Tropical Storm Rolf in 2011, which caused over $1.25 billion in damages.[56] Other costly Mediterranean tropical-like cyclones include Cyclone Qendresa in 2014,[57] Cyclone Apollo in 2021,[58] Cyclone Numa in 2017,[59] and Cyclone Ianos in 2020.[60]
Elsewhere
[edit]Only two South Atlantic tropical cyclones have caused measurable amounts of damages. In 2004, Hurricane Catarina caused $350 million in damages when it made a category two landfall in Santa Catarina. In 2022, Subtropical Storm Yakecan caused $50 million in damages in Uruguay and Southern Brazil.[61][62]
In the eastern portion of the South Pacific, tropical cyclone formation is extremely rare, and Cyclone Yaku in 2023 is the only known system to impact land, causing $690 million in damages in Peru and Ecuador.[63]
See also
[edit]- Outline of tropical cyclones
- List of disasters by cost
- List of the deadliest tropical cyclones
- List of the most intense tropical cyclones
Notes
[edit]References
[edit]- ^ "Epidemiology of Tropical Cyclones: The Dynamics of Disaster, Disease, and Development". July 1, 2005. Retrieved 2023-02-21.
- ^ a b Knabb, Richard D; Rhome, Jamie R; Brown, Daniel P; National Hurricane Center (December 20, 2005). Hurricane Katrina: August 23 – 30, 2005 (PDF) (Tropical Cyclone Report). United States National Oceanic and Atmospheric Administration's National Weather Service. Retrieved August 4, 2013.
- ^ a b Blake, Eric S; Zelinsky, David A (January 23, 2018). Tropical Cyclone Report: Hurricane Harvey: August 17 – September 1, 2017 (PDF) (Report). National Hurricane Center. Retrieved January 27, 2018.
- ^ a b "Billion-Dollar Weather and Climate Disasters". National Oceanic and Atmospheric Administration. 2023. Retrieved January 10, 2023.
- ^ a b "Karen Clark pegs Hurricane Ian losses at $63 billion". Business Insurance. Retrieved 2023-02-22.
- ^ a b Richard J. Pasch; Andrew B. Penny; Robbie Berg (April 5, 2018). "Tropical Cyclone Report: Hurricane Maria" (PDF). National Hurricane Center. Retrieved February 21, 2023.
- ^ a b John P. Cangialosi; Andrew S. Latto; Robbie Berg (March 9, 2018). "Tropical Cyclone Report: Hurricane Irma" (PDF). National Hurricane Center. Retrieved February 21, 2023.
- ^ a b John L. Beven II; Andrew Hagen; Robbie Berg (April 4, 2022). "Tropical Cyclone Report: Hurricane Ida" (PDF). National Hurricane Center. Retrieved February 21, 2023.
- ^ "Costliest U.S. Tropical Cyclones" (PDF). National Centers for Environmental Information. Retrieved 1 July 2023.
- ^ Masters, Jeff (19 March 2021). "WMO: Atlantic hurricanes no longer to receive names from Greek alphabet". Yale Climate Connections. Retrieved 1 July 2023.
- ^ Eschenbacher, Stefanie; Garcia, David Alire; Nickel, Rod (27 October 2023). "After hurricane, Mexican president urges insurers to hurry payouts". Reuters. Archived from the original on October 31, 2023. Retrieved 3 November 2023.
- ^ Steve Jakubowski; Adityam Krovvidi; Adam Podlaha; Steve Bowen. "September 2013 Global Catastrophe Recap" (PDF). Archived from the original (PDF) on October 23, 2021. Retrieved February 21, 2023.
- ^ Costliest U.S. tropical cyclones tables update (PDF) (Report). United States National Hurricane Center. January 12, 2018. Archived (PDF) from the original on January 27, 2018. Retrieved January 12, 2018.
- ^ Elizabeth Albarrán (December 10, 2014). "Aseguradores pagaron 16,600 mdp por daños del huracán Odile" [Insurers paid 16,600 MDP for Hurricane Odile damages] (in Spanish). Retrieved February 21, 2023.
- ^ Beven, Jack (January 10, 2011). "Tropical Storm Agatha Tropical Cyclone Report" (PDF). National Hurricane Center. Retrieved February 21, 2023.
- ^ Brown, Steve; Kerschner, Brian; Zheng Ng, Jin (October 2024). "Natural Catastrophe and Climate Report: Q3 2024" (PDF). ajg.com. Retrieved October 20, 2024.
- ^ "FACTBOX Impact of floods in China after Typhoon Doksuri". Reuters. 11 August 2023. Retrieved 17 August 2023.
- ^ "Situation Report No. 16 for the Combined Effects of Southwest Monsoon and TC EGAY (2023)" (PDF). National Disaster Risk Reduction and Management Council. August 3, 2023. Retrieved 17 August 2023.,
- ^ Hưng Nguyên (8 August 2023). "Đắk Nông thiệt hại khoảng 250 tỷ đồng do thiên tai". daknongnews. Retrieved 10 August 2023.
- ^ "国土交通省|報道資料|令和元年東日本台風の発生した令和元年の水害被害額が統計開始以来最大に令和元年の水害被害額(確報値)を公表". 国土交通省 (in Japanese). Retrieved 2023-02-25.
- ^ Masters, Jeff (16 September 2018). "Typhoon Mangkhut Causes Heavy Damage in Hong Kong, China, and Macau". Wunderground. Retrieved 1 July 2023.
- ^ "Weather, Climate & Catastrophe Insight: 2019 Annual Report" (PDF). Aon Benfield. Archived from the original (PDF) on September 1, 2022. Retrieved February 25, 2023.
- ^ a b "Loss events in Asia 1980 – 2014" (PDF). Munich RE. Archived from the original (PDF) on October 21, 2018. Retrieved February 25, 2023.
- ^ "Weather, Climate & Catastrophe Insight: 2019 Annual Report" (PDF). Aon Benfield. Archived from the original (PDF) on September 1, 2022. Retrieved February 25, 2023.
- ^ Singh, Shiv Sahay (2020-06-07). "Bengal pegs cyclone Amphan damage at ₹1.02 lakh crore". The Hindu. ISSN 0971-751X. Retrieved 2023-03-04.
- ^ "Pathein Cyclone Scenario Planning Summary" (PDF). Shelter Cluster. February 20, 2015. Retrieved March 3, 2023.
- ^ "REPORT ON CYCLONIC DISTURBANCES OVER NORTH INDIAN OCEAN DURING 2007". India Meteorological Department. January 2008. Archived from the original on November 26, 2008. Retrieved March 3, 2023.
- ^ "Global Catastrophe Recap: First Half of 2019" (PDF). Aon Benfield. Archived from the original (PDF) on August 12, 2019. Retrieved March 3, 2023.
- ^ Francis, Simon; Gunturi, Prassad V. S. K.; Arora, Munish (2001). "Performance of Built Environment in the Oct 1999 Orissa Super Cyclone" (PDF). RMSI. Pilani, Rajasthan, India: Birla Institute of Technology and Sciences. Archived from the original (PDF) on February 28, 2008. Retrieved March 3, 2023.
- ^ "Bearing the brunt". The Tribune. May 27, 2019. Retrieved March 3, 2023.
- ^ Bowen, Steve; Kerschner, Brian; Zheng Ng, Jin (January 1, 2025). "Natural Catastrophe and Climate Report: 2025" (PDF). ajg.com. Retrieved January 21, 2025.
- ^ Kenneth Nhundu; Melusi Sibanda; Petronella Chaminuka (September 29, 2021). "Economic Losses from Cyclones Idai and Kenneth and Floods in Southern Africa: Implications on Sustainable Development Goals". Research Gate. Retrieved March 12, 2023.
- ^ "Death toll from South African floods revised down to 435". Reuters. 21 April 2022. Retrieved 24 April 2022.
- ^ "Madagascar: Cyclone Enawo Situation Report No. 5 (14 April 2017) - Madagascar | ReliefWeb". reliefweb.int. 19 April 2017. Retrieved 2023-03-12.
- ^ "Tropical Cyclone Freddy is the longest tropical cyclone on record at 36 days: WMO". World Meteorological Organization. 2024-07-01. Retrieved 2024-08-11.
- ^ "Pretoria Ready For Rescue Operations In Mozambique - Mozambique | ReliefWeb". reliefweb.int. 28 February 2000. Retrieved 2023-03-12.
- ^ "FAO/GIEWS Special Alert No. 301: Southern Africa (3 March 2000) - Mozambique | ReliefWeb". reliefweb.int. 3 March 2000. Retrieved 2023-03-12.
- ^ "Cyclone Yasi to cost insurers AUS $3.5 bln - forecaster". Reuters. 2011-02-03. Retrieved 2023-03-15.
- ^ "Tropical Cyclone Debbie Technical Report" (PDF). Bureau of Meteorology. Retrieved 22 March 2023.
- ^ "In Australia, Record Weather Fuels Climate Policy Process". Leigh Dayton. American Association for the Advancement of Science. 5 February 2013. Archived from the original on 8 February 2013. Retrieved 15 March 2023.
- ^ Dyer, Glenn (2019-04-01). "Rio Confirms Cyclone Veronica Damage". ShareCafe. Retrieved 2023-03-22.
- ^ "Cyclone Veronica: Destructive winds and rain lash Australia". BBC News. 2019-03-25. Retrieved 2023-03-22.
- ^ "Global Catastrophe Recap April 2014" (PDF). Aon Benfield. Archived from the original (PDF) on December 27, 2014. Retrieved March 22, 2023.
- ^ "Rapid Assessment of the Macro and Sectoral Impacts of Flash Floods in the Solomon Islands, April 2014" (PDF). Government of the Solomon Islands. Archived from the original (PDF) on December 26, 2014. Retrieved March 22, 2023.
- ^ "Factbox: Australia's deadliest & most destructive cyclones". Reuters. 2011-02-02. Retrieved 2023-03-22.
- ^ "National Museum of Australia - Cyclone Tracy". www.nma.gov.au. National Museum of Australia, Lawson Crescent. Retrieved 2023-03-22.
- ^ "Australia's worst cyclones since 1970". ABC news. 1 February 2011. Retrieved 1 July 2023.
- ^ Wilson, Nick; Broadbent, Adele; Kerr, John (7 February 2024). "Cyclone Gabrielle: The New Zealand flood victims too scared to go home". Public Health Communication Centre. Retrieved 10 February 2024.
- ^ Scott, Matthew (2023-07-29). "Auckland flood recovery could cost $4 billion". RNZ News. Retrieved 2023-07-30.
- ^ NACANIELI TUILEVUKA (May 24, 2016). "$2.98 billion damage caused by TC Winston". NewsWire. Archived from the original on June 17, 2016. Retrieved March 24, 2023.
- ^ "Supporting cyclone recovery and reconstruction in Vanuatu". Department of Foreign Affairs and Trade. December 11, 2018. Archived from the original on April 20, 2017. Retrieved March 24, 2023.
- ^ "Tuvalu hit with US$90m cyclone damage bill". RNZ. 2015-06-25. Retrieved 2023-03-24.
- ^ "Toll reaches 6,872 dead, 10,000 missing in Libya due to Storm Daniel". La Prensa Latina Media. Online News Editor. Retrieved 13 September 2023.
- ^ "Libya Hurricane Daniel: Situation Report 2 - 27/09/2023". Relief Web. Archived from the original on 30 September 2023. Retrieved 21 September 2023.
- ^ "Extreme flooding caused by Storm Daniel devastates Greece". Financial Times. 8 September 2023. Archived from the original on 9 September 2023. Retrieved 12 September 2023.
- ^ "November 2011 Monthly Cat Recap" (PDF). Aon Benfield. December 6, 2011. pp. 2, 5. Archived from the original (PDF) on December 2, 2018. Retrieved September 23, 2017.
- ^ "November 2014 Global Catastrophe Recap" (PDF). Aon Benfield. 3 December 2014. p. 5. Retrieved 2 December 2017.
- ^ Global Catastrophe Recap October 2021 (PDF) (Report). Aon. 11 November 2021. pp. 7–8. Retrieved 22 November 2021.
- ^ "Global Catastrophe Recap - November 2017" (PDF). Aon Benfield. 7 December 2017. p. 5. Archived from the original (PDF) on 12 December 2017. Retrieved 26 September 2018.
- ^ "Global Catastrophe Recap - September 2020" (PDF). Aon Benfield. 8 October 2020. p. 6. Retrieved 9 October 2020.
- ^ "Monthly Global Tropical Cyclone Summary March 2004". australiasevereweather.com. Retrieved 2023-03-26.
- ^ "Global Catastrophe Recap First Half of 2022" (PDF). Aon Benfield. Retrieved March 25, 2023.
- ^ "Global Catastrophe Recap First Half of 2023" (PDF). Aon Benfield Analytics. Retrieved 4 October 2023.


