File:Drug accumulation ratio.svg
Appearance

Size of this PNG preview of this SVG file: 730 × 599 pixels. Other resolutions: 292 × 240 pixels | 585 × 480 pixels | 936 × 768 pixels | 1,247 × 1,024 pixels | 2,495 × 2,048 pixels | 1,799 × 1,477 pixels.
Original file (SVG file, nominally 1,799 × 1,477 pixels, file size: 25 KB)
File history
Click on a date/time to view the file as it appeared at that time.
| Date/Time | Thumbnail | Dimensions | User | Comment | |
|---|---|---|---|---|---|
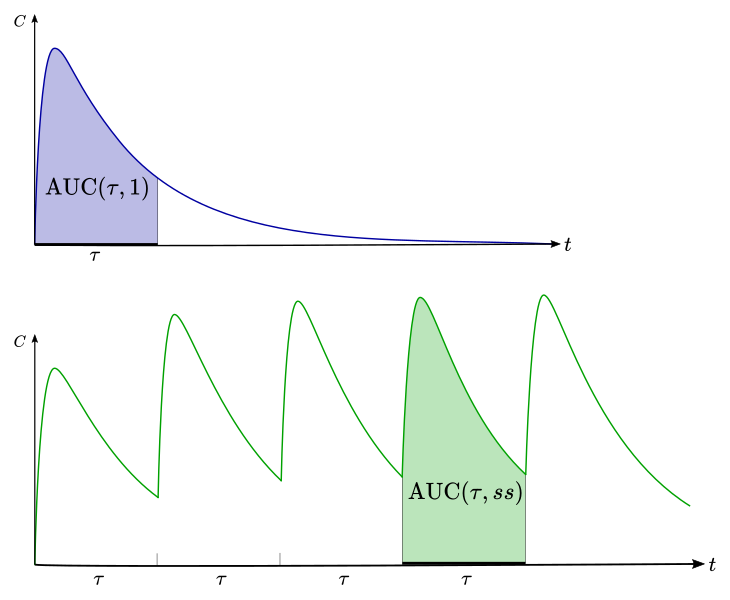
| current | 09:21, 27 May 2021 |  | 1,799 × 1,477 (25 KB) | Anypodetos | {{Information |Description=The {{w|drug accumulation ratio}} ''R<sub>ac</sub>'', according to one common definition, is the ratio of the green area to the blue area. * ''C'': concentration of the drug (e.g. in the blood plasma) * ''t'': time * ''τ'': dosing interval * AUC: {{w|Area under the curve (pharmacokinetics)|area under the curve}} ** 1: single-dose application ** ''ss'': steady state conditions |Source={{own}}, based on File:Linear PK Example.png by User:Alfie66 |Date=2021-05... |
File usage
The following page uses this file:
