Apportionment in the European Parliament
| This article is part of a series on |
 |
|---|
|
|
Apportionment in the European Parliament relates to the distribution of legislative seats in the European Parliament among the states of the European Union. The Parliament's apportionment is are not strictly in accordance with the population of the states, rather they are distributed according to "degressive proportionality".
Background
When the Parliament was established in the 1950s as the 78 member "Common Assembly of the European Coal and Steel Community" the smaller states (Belgium, Luxembourg and the Netherlands) were concerned about being underrepresented and hence they were granted more seats than their population would have allowed. Membership increased to 142 with the Assembly expanded to cover the Economic and Atomic Energy Communities.[1]

It then grew further with each enlargement. Membership reached 626 in 1995 with the Treaty of Amsterdam setting a limit of 700. The Treaty of Nice moved this up to 732 and set out the future distribution for up to 27 states. In 2007 Romania and Bulgaria joined with 35 and 18 members respectively temporally pushing the number of members over the ceiling to 785.[1]
Nice system
At present, the exact number of seats allocated to each country is determined by the treaties, currently the Treaty of Nice, and is adjusted by the accession treaty of each new member. This last occurred with the enlargement in 2007. Hence no change to the seats occurs without ratification by all states. According to the treaties, the maximum number of members in the Parliament is 732. However they are not distributed to take into account enlargements expected to take place during the Parliamentary term. Hence when Romania and Bulgaria joined in 2007 the number of seats temporarily increased to 785, but would drop back down to 736 at the 2009 election.[1]
736 seats between the, as of 2007, twenty-seven states means that there is on average 671,000 citizens represented per MEP. However the seats are distributed according to degressive proportionality, meaning that the greater the population a state has, the more people per member are represented. Further more some states divide their allocated MEPs into sub-national constituencies
However they may not be divided in such away that the system would no longer be proportional, hence the Parliament's constituencies may have no less than 3 seats allocated to them.[2]
Template:EP apportionment influence
Lisbon system
The seat distribution would be amended before the 2009 election via the Lisbon Treaty. The cap on the number of seats would be raised to 750 with a maximum of 96 and a minimum of 6. They would be distributed according to "degressive proportionality" (the larger the state, the more citizens that are represented per MEP).[3] Under the proposals, Germany would lose three seats, while Spain would gain four. France, Sweden and Austria would gain two and the United Kingdom, Poland, the Netherlands, Bulgaria, Latvia, Slovenia, and Malta would all gain one.[4] Changes under Nice and Lisbon;
| |||||||||||||||||||||||||||||||||||||||||||||||||||||||||||||||||||||||||||||||||||||||||||||||||||||||||||||||||||||||||||||||||||||||||||||
All 736 seats to the European Parliament and 18 observers 369 seats needed for a majority | |||||||||||||||||||||||||||||||||||||||||||||||||||||||||||||||||||||||||||||||||||||||||||||||||||||||||||||||||||||||||||||||||||||||||||||
|---|---|---|---|---|---|---|---|---|---|---|---|---|---|---|---|---|---|---|---|---|---|---|---|---|---|---|---|---|---|---|---|---|---|---|---|---|---|---|---|---|---|---|---|---|---|---|---|---|---|---|---|---|---|---|---|---|---|---|---|---|---|---|---|---|---|---|---|---|---|---|---|---|---|---|---|---|---|---|---|---|---|---|---|---|---|---|---|---|---|---|---|---|---|---|---|---|---|---|---|---|---|---|---|---|---|---|---|---|---|---|---|---|---|---|---|---|---|---|---|---|---|---|---|---|---|---|---|---|---|---|---|---|---|---|---|---|---|---|---|---|---|
| Turnout | 43.24% | ||||||||||||||||||||||||||||||||||||||||||||||||||||||||||||||||||||||||||||||||||||||||||||||||||||||||||||||||||||||||||||||||||||||||||||
| |||||||||||||||||||||||||||||||||||||||||||||||||||||||||||||||||||||||||||||||||||||||||||||||||||||||||||||||||||||||||||||||||||||||||||||
 Post-election composition of each member state's delegation
* The number of seats was decreased from 785 to 736 – so this is a nominal figure | |||||||||||||||||||||||||||||||||||||||||||||||||||||||||||||||||||||||||||||||||||||||||||||||||||||||||||||||||||||||||||||||||||||||||||||
| |||||||||||||||||||||||||||||||||||||||||||||||||||||||||||||||||||||||||||||||||||||||||||||||||||||||||||||||||||||||||||||||||||||||||||||
| This article is part of a series on |
 |
|---|
|
|
The 2009 European Parliament election was held in the 27 member states of the European Union (EU) between 4 and 7 June 2009.[5] A total of 736 Members of the European Parliament (MEPs) were elected to represent some 500 million[6] Europeans, making these the biggest trans-national elections in history. An additional 18 observers ("virtual MEPs") were (supposed to be) pre-elected.
The majority of MEPs were elected on Sunday 7 June, but because of traditional polling days varying from country to country according to local custom, some countries held their elections in the three preceding days:
- Thursday 4 June: United Kingdom (including Gibraltar), Netherlands (including Aruba and the Netherlands Antilles)[7]
- Friday 5 June: Ireland, Czech Republic (day 1)
- Saturday 6 June: Cyprus, France (for part of Outre-mer),[8] Italy (day 1), Latvia, Malta, Slovakia, Czech Republic (day 2)
- Sunday 7 June: Austria, Belgium, Bulgaria, Germany, Denmark, Spain, Estonia, Finland, France, Greece, Hungary, Italy (day 2), Lithuania, Luxembourg, Poland, Portugal, Romania, Slovenia, Sweden
In seven EU member states, other votes occurred alongside the elections to the European Parliament: a general election in Luxembourg; local government elections in Latvia,[9] part of the United Kingdom,[10] parts of Germany, Italy, Malta, and Ireland[11] (as well as two by-elections in Ireland, in Dublin Central and Dublin South); regional elections in Belgium; and a referendum on reforming the monarchical rules of succession in Denmark that would give women the same rights through equal primogeniture.
This was the first European Parliament election in which Bulgaria and Romania participated at the same time as the other member states. When those countries joined the EU in 2007, they held elections for MEPs outside the normal electoral calendar.
Opinion polls

A poll sampling nineteen national polls predicted the following results: EPP 265 seats, PES 195, ALDE 95, GUE–NGL 40, Greens-EFA 35, UEN 35. The remaining 70 MEPs were not predicted, but about 20 were expected to be gained by far-right or Libertas candidates. IND/DEM was predicted to fade away due to Libertas' expected success.[12]
A prediction by political scientists Simon Hix (London School of Economics), Michael Marsh (Trinity College Dublin) and Nick Vivyan (London School of Economics) foresaw little change in the distribution of seats, predicting 249 seats for the EPP, 209 for the PES, 87 for ALDE, 58 for UEN or the European Conservatives, 48 for GUE–NGL, 39 for Greens–EFA, 17 for IND/DEM (resulting in its dissolution) and 29 NI; Libertas was not expected to win any seats.[13][14] A later prediction saw 262 seats for the EPP, 194 for the PES, 85 for ALDE, 53 for UEN or the European Conservatives, 40 for GUE–NGL, 50 for Greens–EFA, 23 for IND/DEM (resulting in its dissolution) and 29 NI.[15]
Apportionment of seats
At the previous election member states were granted a fixed allocation of seats for election as determined under the provisions of the Treaty of Nice (current allocation is in the 2007 column below). The admission of Bulgaria and Romania midway through the previous Parliament's term had increased the overall size of the assembly to 785, and under the terms of the Treaty of Nice it was mandated that the seat allocations be modified for this election, dropping 49 seats to keep the overall size of the Parliament down.
It had been the stated desire of the member-state governments to ratify the Treaty of Lisbon before the election so that its articles governing the European Parliament could enter force as of this election. However, this was blocked by the Irish rejection of the treaty in a referendum. Under Lisbon, there would be a somewhat different allocation of seats, with fewer seats eliminated, leading to a slightly different distribution totalling 751 MEPs. Were the Lisbon Treaty to be subsequently ratified, it was planned to give in advance, prior to the next elections, the additional seats to the countries that were to see an increase in representation under the provisions of Lisbon; this would bring the number of MEPs to 754 for a transitional period until 2014.[16]
To have the additional MEPs ready at hand, 18 "phantom MEPs" were supposed to be elected at the election (which, however, did not happen in France). These were expected to get observer status in the European Parliament and full payment from the day the Lisbon Treaty entered into force (which did not happen either), but only to become full members of parliament if an additional protocol were ratified.[17][18] The latter was to require a decision by the European Council.[19]
| Member state | 2007 | 2009 | Change |
|---|---|---|---|
| Germany | 99 | 99 | ±0 |
| Czech Republic | 24 | 22 | −2 |
| Slovakia | 14 | 13 | −1 |
| France | 78 | 72 | −6 |
| Greece | 24 | 22 | −2 |
| Ireland | 13 | 12 | −1 |
| Italy | 78 | 72 | −6 |
| Hungary | 24 | 22 | −2 |
| Lithuania | 13 | 12 | −1 |
| United Kingdom† | 78 | 72 | −6 |
| Portugal | 24 | 22 | −2 |
| Latvia | 9 | 8 | −1 |
| Spain | 54 | 50 | −4 |
| Sweden | 19 | 18 | −1 |
| Slovenia | 7 | 7 | ±0 |
| Poland | 54 | 50 | −4 |
| Austria | 18 | 17 | −1 |
| Cyprus | 6 | 6 | ±0 |
| Romania | 35 | 33 | −2 |
| Bulgaria | 18 | 17 | −1 |
| Estonia | 6 | 6 | ±0 |
| Netherlands | 27 | 25 | −2 |
| Finland | 14 | 13 | −1 |
| Luxembourg | 6 | 6 | ±0 |
| Belgium | 24 | 22 | −2 |
| Denmark | 14 | 13 | −1 |
| Malta | 5 | 5 | ±0 |
| Total: | 785 | 736 | −49 |
† – Includes Gibraltar, but not any of the other overseas territories or Crown dependencies.
Italicised countries are divided into sub-national constituencies.
Sources: Institutions: EP Archived 24 June 2007 at the Wayback Machine, Const. changes, Protocol 34.
Campaign

Many of the national parties running in the election are affiliated to European political parties. These pan-European parties included the EPP, PES, ELDR, EFA, European Greens, AEN, PEL, EDP and EUD. The question of which was the first to campaign transnationally is the subject of some debate, with the European Greens stating that they were the first in 2004.[20] New parties that aspired to pan-European status during the 2009 elections include Newropeans, Europe United,[21] Europe – Democracy – Esperanto and Libertas Party Limited. The role for pan-European political parties has been expanded by changes enacted by the European Commission in 2007 under the direction of Margot Wallström.[22]
Four incumbent European Commissioners were to run as candidates in the election: Viviane Reding (Luxembourg, information society & media, Christian Social People's Party/EPP), Louis Michel (Belgium, development & humanitarian aid, Reformist Movement/ELDR), Danuta Hübner (Poland, regional policy, Civic Platform/EPP), Meglena Kuneva (Bulgaria, consumer protection, National Movement for Stability and Progress/ELDR).[23] Ján Figeľ (Slovakia, education, training & culture, Christian Democratic Movement/EPP) was tipped to run but ultimately did not, instead seeking to become the new chairman of his party.[24]
Kuneva later decided not to take up her seat in the European Parliament.[25]
Issue-based campaigns
These divide into EU-wide and nationally based campaigns, often by non-governmental organisations focussed on specific policy areas. They are designed to influence MEP candidates, those with a strong interest in the issue, and voters in general. Examples of nationally based campaigns include those of the Royal College of Nursing[26][27] and British Overseas NGOs for Development.[28][29]
Media coverage
The European Parliament, National broadcasters, the EBU, with the cooperation of the Communication Commissioner, Margot Wallström, are jointly working to make the 2009 election more interesting to the public and increase turnout. Previously, diverse news media in the European Union, and the fact that the election takes place over several days, have made it hard to attract viewers. The media consortium is hoping to focus the 2009 election more towards the EU level and the European Parliament itself, hoping to make the election more interesting and cosmetically appealing for television viewers.[30]
From 1 April Parliament started putting up election posters, internet banners and billboards encouraging people to vote, with messages such as "How much should we tame financial markets?" to demonstrate the role of Parliament. The same 10 posters, designed by Berlin-based advertising company Scholz & Friends Group, were translated into all 23 languages and have been deployed across the whole of the EU. However, some posters are put up more in countries where the issues they present are of more significance and the most posters will be put up in those countries which had the lowest turnout in 2004. The end slogan is "Use your vote in the European Parliament Elections" with the date of the election in that country. The entire campaign costs 18 million euros, or 0.05 euros per eligible voter, with Germany, Spain and Italy donating some advertising space free of charge.[31]
Role of the Treaty of Lisbon
It had initially been foreseen that the Treaty of Lisbon would have entered into force by the time of these elections, making them the first to be held under its provisions. However, primarily because of the No vote in the referendum in Ireland, the framework established by the Treaty of Nice will be used again. Amongst other differences, the number of MEPs to be returned depends upon which rules are in effect: while 736 MEPs will be elected under the Nice rules, this number would have increased to 751 if the Lisbon Treaty were in force.
A further change that Lisbon would have brought was an increase to the powers of Parliament, including powers over the appointment of the President of the European Commission.[32] It had been suggested by some that political parties could run with candidates for the Commission President;[33] with leaders now linking the post to elections and that convention having been enshrined in the Constitution, further encouraging the possibility.[34]
In 2007, it emerged that current Commission President José Manuel Barroso would likely seek a second term,[22] which he confirmed on 19 July 2008,[35] and he received the backing of French President Nicolas Sarkozy.[36] In beginning to formalise the emerging party-political nature of the office, in early 2009 the centre-right People's Party backed Barroso as their candidate and the centre-left socialists opposed, however they did not put forward their own formal candidate.[37]
Results
The national results as of 8 June 2009 are as follows. (based on predictions, to be confirmed)
Full members
736 members with full voting rights (the groups used are the groups they had been associated with directly prior to the elections):
| Political group Country |
EPP | PES[38] | ALDE | Greens-EFA | EUL-NGL | UEN | ID | Other (incl. NI) |
MEPs | Turnout | Cite |
|---|---|---|---|---|---|---|---|---|---|---|---|
| Austria | 6 (ÖVP) | 4 (SPÖ) | 2 (Grüne) | 3 (Martin) 2 (FPÖ) |
17 | 45.97% | [39][40] [41] | ||||
| Belgium | 3 (CD&V) 1 (N-VA) 1 (CDH) 1 (CSP-EVP) |
3 (PS) 2 (SP.A) |
3 (OpenVLD) 2 (MR) |
1 (Groen!) 2 (Ecolo) |
2 (VB) 1 (LDD) |
22 | 91% | [42] | |||
| Bulgaria | 5 (GERB) 1 (SDS) 1 (DSB) |
4 (BSP) | 3 (DPS) 2 (NDSV) |
2 (Attack) | 18 | 37.49% | [43][44] | ||||
| Cyprus | 2 (DISY) | 1 (EDEK) | 2 (AKEL) | 1 (DIKO) | 6 | 58.88% | [45][46] | ||||
| Czech Republic | 2 (KDU–ČSL) | 7 (ČSSD) | 4 (KSČM) | 9 (ODS) | 22 | 28.22% | [47][48] | ||||
| Denmark | 1 (C) | 4 (A) | 3 (V) | 2 (F) | 1 (N) | 2 (O) | 13 | 59.5% | [49] | ||
| Estonia | 1 (IRL) | 1 (SDE) | 1 (RE) 2 (KE) |
1 (Tarand) | 6 | 43.9% | [50][51] | ||||
| Finland | 3 (Kok.) 1 (KD) |
2 (SDP) | 3 (Kesk.) 1 (SFP) |
2 (Vihr.) | 1 (PS) | 13 | 40.3% | [53] | |||
| France | 24 (UMP) 3 (NC) 2 (LGM) |
14 (PS) | 6 (MoDem) | 14 (E-É) | 5 (FG) | 1 (Libertas) | 3 (FN) | 72 | 40.48% | [54][55] | |
| Germany | 34 (CDU) 8 (CSU) |
23 (SPD) | 12 (FDP) | 14 (Grüne) | 8 (Linke) | 99 | 43.3% | [56] | |||
| Greece | 8 (ND) | 8 (PASOK) | 1 (Greens) | 2 (KKE) 1 (SYRIZA) |
2 (LAOS) | 22 | 52.63% | [57] | |||
| Hungary | 14 (Fidesz-MPP) | 4 (MSZP) | 3 (Jobbik) 1 (MDF) |
22 | 36.28% | [58][59] | |||||
| Ireland | 4 (FG) | 3 (Lab) | 3 (FF) 1 (Harkin) |
1 (SP) | 12 | 57.6% | [60][61] | ||||
| Italy | 29 (PdL) 5 (UDC) 1 (SVP) |
21 (PD) | 7 (IdV) | 9 (LN) | 72 | 65.05% | [62] | ||||
| Latvia | 1 (JL) 2 (PS) |
1 (LPP/LC) | 1 (PCTVL) | 1 (TB/LNNK) | 2 (SC) | 8 | 52.57% | [63][64] | |||
| Lithuania | 4 (TS-LKD) | 3 (LSDP) | 1 (DP) 1 (LRLS) |
2 (TT) | 1 (LLRA) | 12 | 20.54% | [65] | |||
| Luxembourg | 3 (CSV) | 1 (LSAP) | 1 (DP) | 1 (Gréng) | 6 | 91% | [66] | ||||
| Malta | 2 (PN) | 3 (PL) | 5 | 78.8% | [67][68] | ||||||
| Netherlands | 5 (CDA) | 3 (PvdA) | 3 (VVD) 3 (D66) |
3 (GL) | 2 (SP) | 2 (CU-SGP) | 4 (PVV) | 25 | 36.9% | [69] | |
| Poland | 25 (PO) 3 (PSL) |
7 (SLD-UP) | 15 (PiS) | 50 | 24.53% | [70][71] | |||||
| Portugal | 8 (PSD) 2 (CDS–PP) |
7 (PS) | 2 (CDU) 3 (BE) |
22 | 36.77% | [72] | |||||
| Romania | 10 (PD-L) 2 (UDMR) 1 (Băsescu) 1 (Tőkés) |
11 (PSD-PC) | 5 (PNL) | 3 (PRM) | 33 | 27.67% | [73] | ||||
| Slovakia | 2 (SDKÚ-DS) 2 (KDH) 2 (SMK) |
5 (Smer) | 1 (SNS) 1 (LS-HZDS) |
13 | 19.63% | [74][75] | |||||
| Slovenia | 2 (SDS) 1 (NSi) |
2 (SD) | 1 (LDS) 1 (Zares) |
7 | 28.02% | [76][77] | |||||
| Spain | 23 (PP) | 21 (PSOE) | 1 (CDC) 1 (EAJ-PNV) |
1 (ERC) 1 (ICV) |
1 (IU) | 1 (UPyD) | 50 | 46.0% | [78][79] | ||
| Sweden | 4 (M) 1 (KD) |
5 (S) | 3 (FP) 1 (C) |
2 (MP) | 1 (V) | 1 (PP) | 18 | 45.53% | [80] | ||
| United Kingdom | 13 (LAB) | 11 (LD) | 2 (GPEW) 2 (SNP) 1 (PC) |
1 (SF) | 13 (UKIP) | 26 (CON/UCUNF) 2 (BNP) 1 (DUP) |
72 | 34.48% | [81][82] | ||
| Total | 264 | 161 | 83 | 53 | 34 | 14 | 18 | 110 | 736 | 43.24% | [83][84] |
| Political group | EPP | PES | ALDE | Greens-EFA | EUL-NGL | UEN | ID | Other (incl. NI) |
MEPs | Turnout | Cite |
| Previous total (unadjusted) |
288 (−24) | 217 (−56) | 100 (−17) | 43 (+10) | 41 (−8) | 44 (−30) | 22 (−4) | 30 (+80) | 785 (−49) | ||
| Previous total (adjusted) |
244 (+20) | 196 (−35) | 88 (−5) | 40 (+13) | 38 (−5) | 24 (−10) | 21 (−3) | 85 (+25) | 736 (±0) | ||
NB: "Adjusted" figures restate group numbers to proportionately reflect the reduction of the Parliament's size by 49, and to reflect the following political group movements announced prior to the election: DIKO (CY) from ALDE to Other; ODS (CZ) from EPP to Other; FF (IE) from UEN to ALDE; AN (IT) from UEN to EPP; PD (IT) from PES and ALDE to Other; PiS (PL) from UEN to Other; and Conservatives/UCUNF (UK) from EPP to Other.
Note:Postal votes missing from Slovenia. Complete results were supposed to be announced on 15 June
Observers
18 additional seats were designated to be filled by "observers" when the Lisbon treaty goes into force, to account for new seat distribution with the Lisbon Treaty. On 23 June an intergovernmental conference (IGC) of EU member states amended a protocol attached to the Lisbon treaty on transitional arrangements. Those transitional arrangements were originally envisaged as taking the total number of MEPs from 785 to 751 for the 2009 elections. The amended text says that the protocol "shall enter into force if possible on 1 December 2010". Germany is allowed to retain its three additional MEPs until the next elections in 2014.
The member states entitled to observer seats were supposed to make provisions before the 2009 elections for who would get the additional seats in the European Parliament.[85][86] However, this was not done by France. This created a limbo for the observers elected from other countries, since all observers are supposed to start their work at the same time. In December 2011, they took their seats.
The following is a list of all observer seats[87]
| Country | National Party | Political Group |
|---|---|---|
| Austria | SPÖ | S&D |
| Austria | BZÖ | NI |
| Bulgaria | DSB (SK) | EPP |
| France | EÉLV | Greens-EFA |
| France | UMP | EPP |
| Italy | UDC | EPP |
| Latvia | PS | EPP |
| Malta | PL | S&D |
| Netherlands | PVV | NI |
| Poland | PSL | EPP |
| Slovenia | SDS | EPP |
| Spain | PP | EPP |
| Spain | UDC (CpE) | EPP |
| Spain | PSOE | S&D |
| Spain | PSOE | S&D |
| Sweden | S | S&D |
| Sweden | PP | Greens-EFA |
| United Kingdom | Conservatives | ECR |
Note that this table already includes the grouping changes announced by the parties and reflected in the section below.
Group changes
Traditionally, realignment between the different political groups and European political parties occurs in the runup to the election and in the time between the election and the first sitting of the European Parliament, when the political groups are constituted; the first sitting of the EP elected in 2009 is set for 14 July 2009.[88]
New rules regarding the minimum number of members needed for a political group will come into effect following the 2009 election. The PES and EPP–ED had initially proposed to raise the limit for groups in the EP from 20 MEPs and one fifth of member states to 30 MEPs and a quarter of member states, which would effectively close down UEN (only MEPs from six countries) and I/D (only 22 MEPs). All five smaller groups (UEN and I/D plus ALDE, Greens–EFA and GUE–NGL) protested against these proposed changes.[89] The proposal was voted down 15 to 14 in committee, and in an eventual compromise, new rules were approved in plenary on 9 July 2008 which require 25 MEPs from at least a quarter of the member states (i.e. seven member states).[90] Although UEN and I/D still fail to meet the basic requirements of the new rules, the adopted compromise also included a provision allowing the continued existence of a group which had fallen below the threshold, but only if it still had members from at least a fifth of the member states and only if it had been founded at least a year before dropping below the threshold; if there is "sufficient evidence" of the abuse of this provision, it need not be applied.[91]
Union for Europe of the Nations
The Union for Europe of the Nations (UEN) was a parliamentary group which traced its ancestry back to its origins as a Gaullist ideological alignment. It was not reconstituted following this election. The associated Alliance for Europe of the Nations (AEN) party lost MEPs to other groupings.
The largest single contributor of MEPs to the UEN group, the Italian National Alliance, merged with Silvio Berlusconi's Forza Italia party to form the People of Freedom (PdL) on 29 March 2009.[92] The combined party belonged to the EPP and the MEPs elected in 2009 sat in that parliamentary grouping.[93] This move came after a series of attempts by National Alliance to abandon more staunchly national conservatism and Eurosceptic parties and move towards the moderate European centre-right, including a previous application for EPP membership.
Ireland's Fianna Fáil joined the European Liberal Democrat and Reform Party (ELDR) on 16 April 2009.[94] Fianna Fáil has long been a proponent of European integration and was openly uncomfortable about its European affiliation, with former leader Bertie Ahern often distancing his party from the right-wing positions of his groupmates and describing UEN as purely a "technical arrangement". Fianna Fáil very nearly joined ALDE during the group reshuffle after the 2004 European elections, and had also previously explored seeking membership in ELDR.[95][96]
Other significant sources of the group's MEPs were Poland's Self-Defence of the Republic of Poland party and Latvia's For Fatherland and Freedom party subsequently joined the European Conservatives and Reformists group.
European Democrats
The European Democrats group, which had previously sat with the European People's Party's parliament group was dissolved after the election. The group's three political parties: the United Kingdom's Conservatives and Ulster Unionists and the Czech Civic Democrats, left to found the Alliance of European Conservatives and Reformists. The group's only other MEP, an Italian from the Pensioners' Party, failed to win reelection.
Socialist Party
The Italian Democratic Party was founded in 2007 from two parties in the Olive coalition decided to merge: Democrats of the Left and Democracy is Freedom – The Daisy a socialist and a liberal party respectively. The merged resulted in disagreements over which European political party the Democratic Party would belong to, with many former members of the Daisy party objection to member of the Party of European Socialists (PES).[97] Eventually it was agreed that the party would sit with the PES in the European Parliament but not join the party. The new parliamentary grouping was originally going to be called the "Alliance of Socialists and Democrats for Europe",[98] but this name was too similar to the name of the liberal group, the Alliance of Liberals and Democrats for Europe, so the name was changed to Progressive Alliance of Socialists and Democrats (S&D).[99]
The Democratic Party (DIKO) of Cyprus, which had previously sat with Alliance of Liberals and Democrats for Europe joined the S&D after the 2009 elections but remained outside of a pan-European political party.[100]
Parliamentary groups 2009

S&D (184)
ALDE (84)
Greens – EFA (55)
ECR (54)
EUL-NGL (35)
EFD (32)
Non-Inscrits (27)
The following changes occurred, which makes the make-up of the groups as follows:
- ALDE, Greens-EFA and EUL-NGL continue to exist.
- ECR is constituted
- PES becomes S&D.
- EPP-ED becomes EPP again
- I/D is replaced by EFD
- UEN is disbanded.
| Political group[101] Country |
EPP | S&D | ALDE | Greens-EFA | ECR | EUL-NGL | EFD | NI | MEPs |
|---|---|---|---|---|---|---|---|---|---|
| Austria | 6 (ÖVP) | 4 (SPÖ) | 2 (Grüne) | 3 (Martin) 2 (FPÖ) |
17 | ||||
| Belgium | 3 (CD&V) 1 (CDH) 1 (CSP-EVP) |
3 (PS) 2 (SP.A) |
3 (OpenVLD) 2 (MR) |
1 (Green!) 2 (Ecolo) 1 (N-VA) |
1 (LDD) | 2 (VB) | 22 | ||
| Bulgaria | 5 (GERB) 1 (SDS) 1 (DSB) |
4 (BSP) | 3 (DPS) 2 (NDSV) |
2 (Attack) | 18 | ||||
| Cyprus | 2 (DISY) | 1 (EDEK) 1 (DIKO) |
2 (AKEL) | 6 | |||||
| Czech Republic | 2 (KDU–ČSL) | 7 (ČSSD) | 9 (ODS) | 4 (KSČM) | 22 | ||||
| Denmark | 1 (C) | 4 (A) | 3 (V) | 2 (F) | 1 (N) | 2 (O) | 13 | ||
| Estonia | 1 (IRL) | 1 (SDE) | 1 (RE) 2 (KE) |
1 (Tarand) | 6 | ||||
| Finland | 3 (Kok.) 1 (KD) |
2 (SDP) | 3 (Kesk.) 1 (SFP) |
2 (Vihr.) | 1 (PS) | 13 | |||
| France | 29 (UMP) | 14 (PS) | 6 (MoDem) | 14 (E-É) | 5 (FG) | 1 (Libertas) | 3 (FN) | 72 | |
| Germany | 34 (CDU) 8 (CSU) |
23 (SPD) | 12 (FDP) | 14 (Grüne) | 8 (Linke) | 99 | |||
| Greece | 8 (ND) | 8 (PASOK) | 1 (Greens) | 2 (KKE) 1 (SYRIZA) |
2 (LAOS) | 22 | |||
| Hungary | 14 (Fidesz-MPP) | 4 (MSZP) | 1 (MDF) | 3 (Jobbik) | 22 | ||||
| Ireland | 4 (FG) | 3 (Lab) | 3 (FF) 1 (Harkin) |
1 (SP) | 12 | ||||
| Italy | 29 (PdL) 5 (UDC) 1 (SVP) |
21 (PD) | 7 (IdV) | 9 (LN) | 72 | ||||
| Latvia | 2 (PS) 1 (JL) |
1 (TSP) | 1 (LPP/LC) | 1 (PCTVL) | 1 (TB/LNKK) | 1 (LSP) | 8 | ||
| Lithuania | 4 (TS-LKD) | 3 (LSDP) | 1 (DP) 1 (LRLS) |
1 (LLRA) | 2 (TT) | 12 | |||
| Luxembourg | 3 (CSV) | 1 (LSAP) | 1 (DP) | 1 (Déi Gréng) | 6 | ||||
| Malta | 2 (PN) | 3 (PL) | 5 | ||||||
| Netherlands | 5 (CDA) | 3 (PvdA) | 3 (VVD) 3 (D66) |
3 (GL) | 1 (CU) | 2 (SP) | 1 (SGP) | 4 (PVV) | 25 |
| Poland | 25 (PO) 3 (PSL) |
6 (SLD) 1 (UP) |
15 (PiS) | 50 | |||||
| Portugal | 8 (PSD) 2 (CDS) |
7 (PS) | 2 (CDU) 3 (BE) |
22 | |||||
| Romania | 10 (PD-L) 3 (UDMR) 1 (Băsescu) |
11 (PSD-PC) | 5 (PNL) | 3 (PRM) | 33 | ||||
| Slovakia | 2 (SDKÚ-DS) 2 (KDH) 2 (SMK) |
5 (Smer) | 1 (LS-HZDS) | 1 (SNS) | 13 | ||||
| Slovenia | 2 (SDS) 1 (NSi) |
2 (SD) | 1 (LDS) 1 (Zares) |
7 | |||||
| Spain | 23 (PP) | 21 (PSOE) | 1 (CDC) 1 (EAJ-PNV) |
1 (ERC) 1 (ICV) |
1 (IU) | 1 (UPyD) | 50 | ||
| Sweden | 4 (M) 1 (KD) |
5 (S) | 3 (FP) 1 (C) |
2 (MP) 1 (PP) |
1 (V) | 18 | |||
| United Kingdom | 13 (Lab) | 11 (LD) | 2 (GPEW) 2 (SNP) 1 (PC) |
24 (Con) 1 (UCUNF) |
1 (SF) | 13 (UKIP) | 2 (BNP) 1 (DUP) 1 (Con) |
72 | |
| Total | 265 | 184 | 84 | 55 | 54 | 35 | 32 | 27 | 736 |
Parliament president
In the first vote of the new Parliament Jerzy Buzek (EPP, Poland) was elected Parliament President, winning with 555 to 89 votes over his opponent Eva-Britt Svensson (EUL-NGL, Sweden).[102]
The two candidates were:
- For the right of centre European People's Party, former Polish PM Jerzy Buzek was nominated by his group EPP-ED and supported by the PES and ALDE groups.
- On the left, Swedish MEP Eva Britt Svensson was nominated by her group EUL-NGL.
MEPs voted in a secret ballot on Tuesday morning 14 July 2009.[103]
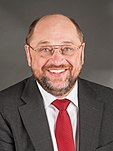
The two largest groups in Parliament, the EPP-ED and PES, agreed to share the post of President of the European Parliament as they have done for all but two terms of Parliament. The first half of the term was taken by Jerzy Buzek MEP of the EPP, who was the first MEP from Eastern Europe to hold the post. He passed it over to Martin Schulz MEP, the current leader of PES.[104] The deal got support form The ALDE group (their candidate Graham Watson dropped out from the race).[105]
The other official candidate was Eva-Britt Svensson, nominated from EUL-NGL.[106] She campaigned with the slogan "a different voice". She was the first MEP from Sweden to candidate to the position.
References
- ^ a b c "Composition of the European Parliament". European NAvigator. Retrieved 2007-06-12.
- ^ "Proposals by the Electoral Commission to reduce Scottish representation in Europe". Scottish Conservatives. 2007-10-02. Retrieved 2007-10-11.
- ^ "Distribution of EP seats: Constitutional Affairs Committee approvals proposal". Europa (web portal). 2007-10-02. Retrieved 2007-10-07.
- ^ "Composition of the European Parliament after European elections in June 2009". Europa (web portal). 2007-10-11. Retrieved 2007-10-11.
- ^ "European Parliament". Europa (web portal). 21 May 2008. Retrieved 8 June 2009.
- ^ "CIA — The World Factbook — European Union". Cia.gov. Retrieved 6 April 2009.
- ^ (in Dutch)Telegraaf.nl 1500 votes on the Antilles
- ^ In the order of the time zones: Saint Pierre and Miquelon, French Guiana, Guadeloupe, Martinique, Saint Barthélemy, Saint Martin, French Polynesia
- ^ Delfi As. "Муниципальные выборы". Rus.delfi.lv. Archived from the original on 17 May 2009. Retrieved 8 June 2009.
- ^ Department of the Official Report (Hansard), House of Commons, Westminster (4 November 2008). "House of Commons Hansard Debates from 4 November 2008 – Local Government Motion". Publications.parliament.uk. Retrieved 6 April 2009.
{{cite web}}: CS1 maint: numeric names: authors list (link) - ^ "News — Department of the Environment, Heritage & Local Government". Environ.ie. Retrieved 6 April 2009.[dead link]
- ^ Philippa Runner (24 February 2009). "EUobserver". EUobserver. Retrieved 6 April 2009.
- ^ Honor Mahony. "EUobserver". EUobserver. Retrieved 11 April 2009.
- ^ "Home". Predict09.eu. Archived from the original on 10 April 2009. Retrieved 11 April 2009.
- ^ "Home". Predict09.eu. 4 June 2009. Archived from the original on 23 April 2009. Retrieved 8 June 2009.
- ^ Europa.eu, EP Press Release 16 December 2008
- ^ Waterfield, Bruno (22 May 2009). "Eighteen 'phantom' MEPs will do no work for two years". The Telegraph. London. Retrieved 8 June 2009.
- ^ "MaltaMedia.com". Maltamediaonline.com. 10 June 2009. Archived from the original on 14 July 2011. Retrieved 15 March 2010.
- ^ Peter, Laurence (25 May 2009). "Europe | Europe may elect 'virtual MEPs'". BBC News. Retrieved 29 May 2009.
- ^ history of the European Green Party Archived 15 May 2009 at the Wayback Machine at europeangreens.org
- ^ "★ Europe United — Start — News". Europeunited.eu. Archived from the original on 28 April 2009. Retrieved 5 May 2009.
- ^ a b European politics to get more political, EU Observer 27 June 2007
- ^ "Kuneva to lead Liberal list in Bulgaria | EU — European Information on EU Elections 09". EurActiv.com. 27 April 2009. Archived from the original on 1 May 2009. Retrieved 5 May 2009.
- ^ "Commissioners tipped to run in EU elections | EU — European Information on EU Elections 09". EurActiv.com. Archived from the original on 21 February 2009. Retrieved 6 April 2009.
- ^ "Bulgarian EU Commissioner turns down EP seat – EU Business News". EUbusiness.com. 10 July 2009. Archived from the original on 5 January 2010. Retrieved 15 March 2010.
- ^ "European elections 2009". RCN. Archived from the original on 8 September 2012. Retrieved 29 May 2009.
- ^ "Nursing UK and abroad". RCN. Archived from the original on 24 October 2010. Retrieved 29 May 2009.
- ^ "EU elections 2009 · Campaigning in Europe · BOND". Bond.org.uk. 30 March 2009. Archived from the original on 5 May 2009. Retrieved 29 May 2009.
- ^ "Campaigning in Europe · Europe · BOND". Bond.org.uk. Archived from the original on 30 May 2009. Retrieved 29 May 2009.
- ^ EU wants to dress up 2009 elections on TV, EUobserver.com Accessed 26 February 2007
- ^ FAQ's on Parliament's election campaign Archived 23 May 2009 at the Wayback Machine, Europarl-Website
- ^ Europa website. "The Union's institutions: The European Parliament". Archived from the original on 1 February 2009. Retrieved 28 June 2007.
- ^ Size shouldn't matter commentisfree.guardian.co.uk 10 January 2007
- ^ Too much champagne, not enough leadership Archived 30 May 2009 at the Wayback Machine opendemocracy.net 10 July 2003
- ^ Honor Mahony (19 July 2008). "Barroso admits he wants to be EU commission president for a second time". EUobserver. Retrieved 6 April 2009.
- ^ Honor Mahony. "Sarkozy backs Barroso for second go as EU commission president". EUobserver. Retrieved 6 April 2009.
- ^ EU Socialists disagree with early choice of commission chief, EU Observer
- ^ Since 23 June 2009, S&D
- ^ "European election results 2009 for Austria". Results of the 2009 European Elections. TNS opinion. Archived from the original on 16 January 2016. Retrieved 7 June 2009.
- ^ "Martin hängt FPÖ ab" (in German). Orf.at. Archived from the original on 22 March 2012. Retrieved 8 June 2009.
- ^ "SPÖ büßt weiteren Sitz in EU-Parlament ein" (in German). Orf.at. Archived from the original on 22 March 2012. Retrieved 11 June 2009.
- ^ "European election results 2009 for Belgium". Results of the 2009 European Elections. TNS opinion. Archived from the original on 12 June 2009. Retrieved 7 June 2009.
- ^ "European election results 2009 for Bulgaria". Results of the 2009 European Elections. TNS opinion. Archived from the original on 11 June 2009. Retrieved 7 June 2009.
- ^ M3 Web. "Bulgaria: Bulgaria with 38% Voter Turnout in 2009 European Elections – Exit Poll – Novinite.com – Sofia News Agency". Novinite.com. Archived from the original on 12 October 2012. Retrieved 8 June 2009.
{{cite web}}: CS1 maint: numeric names: authors list (link) - ^ "European election results 2009 for Cyprus". Results of the 2009 European Elections. TNS opinion. Archived from the original on 16 January 2016. Retrieved 7 June 2009.
- ^ "Κύπρος: Μεγάλη η αποχή στις ευρωεκλογές 2009". Express.gr. Archived from the original on 7 March 2012. Retrieved 8 June 2009.
- ^ "European election results 2009 for the Czech Republic". Results of the 2009 European Elections. TNS opinion. Archived from the original on 11 June 2009. Retrieved 7 June 2009.
- ^ "Overall results of voting". volby.cz. Retrieved 8 June 2009.
- ^ "Europavalg". Danmarks Radio. Archived from the original on 11 June 2009. Retrieved 7 June 2009.
- ^ "European election results 2009 for Estonia". Results of the 2009 European Elections. TNS opinion. Archived from the original on 11 June 2009. Retrieved 7 June 2009.
- ^ "Estonian National Electoral Committee: Results of the European Parliament Election, 2009". Vvk.ee. Retrieved 8 June 2009.
- ^ Hääletamis- ja valimistulemus (in Estonian)
- ^ "European election results 2009 for Finland". Results of the 2009 European Elections. TNS opinion. Archived from the original on 12 June 2009. Retrieved 7 June 2009.
- ^ "European election results 2009 for France". Results of the 2009 European Elections. Archived from the original on 20 March 2012. Retrieved 7 June 2009.
- ^ "TNS Sofres, leader français des études marketing et d'opinion". Tns-sofres.com. Archived from the original on 11 June 2009. Retrieved 8 June 2009.
- ^ "European election results 2009 for Germany". Results of the 2009 European Elections. TNS opinion. Archived from the original on 11 June 2009. Retrieved 7 June 2009.
- ^ "European election results 2009 for Greece". Results of the 2009 European Elections. Ministry of Internal Affairs. Retrieved 6 October 2009.
- ^ "European election results 2009 for Hungary". Results of the 2009 European Elections. TNS opinion. Archived from the original on 11 June 2009. Retrieved 7 June 2009.
- ^ "Index – Külföld". Index.hu. 8 June 2008. Retrieved 8 June 2009.
- ^ "RTÉ News: European Elections 2009". RTÉ.ie. Archived from the original on 10 August 2009. Retrieved 8 June 2009.
- ^ "Ministers' meeting a charade, says new MEP Higgins". The Irish Times. 19 June 2009. Archived from the original on 8 March 2012. Retrieved 19 June 2009.
- ^ "European election results 2009 for Italy". Results of the 2009 European Parliament election. TNS opinion. Archived from the original on 12 June 2009. Retrieved 8 June 2009.
- ^ "European election results 2009 for Latvia". Results of the 2009 European Elections. TNS opinion. Archived from the original on 16 January 2016. Retrieved 7 June 2009.
- ^ "В Латвии более половины избирателей приняли участие в выборах в Европарламент – Новости России – ИА REGNUM". Regnum.ru. Retrieved 8 June 2009.
- ^ "European election results 2009 for Lithuania". Retrieved 7 June 2009.
- ^ "European election results 2009 for Luxembourg". Results of the 2009 European Elections. TNS opinion. Archived from the original on 16 January 2016. Retrieved 7 June 2009.
- ^ "European election results 2009 for Malta". Results of the 2009 European Elections. TNS opinion. Archived from the original on 16 January 2016. Retrieved 7 June 2009.
- ^ "European Parliament Elections – Official Results". Department of Information (Malta). 9 June 2009. Retrieved 9 June 2009.
- ^ "European election results 2009 for the Netherlands". Dutch election committee. Archived from the original on 14 June 2009.
- ^ "European election results 2009 for Poland". Results of the 2009 European Elections (98,9% of votes). PKW. Archived from the original on 11 June 2009. Retrieved 8 June 2009.
- ^ "PO zabiera europosła PSL Policzyli 98,9 proc. głosów". Tvn24.pl. 8 June 2009. Archived from the original on 8 March 2012. Retrieved 8 June 2009.
- ^ "European election results 2009 for Portugal". Results of the 2009 European Elections. TNS opinion. Archived from the original on 12 June 2009. Retrieved 7 June 2009.
- ^ "European election results 2009 for Romania". Results of the 2009 European Elections. TNS opinion. Archived from the original on 11 June 2009. Retrieved 7 June 2009.
- ^ "European election results 2009 for Slovakia". Results of the 2009 European Elections. TNS opinion. Archived from the original on 16 January 2016. Retrieved 7 June 2009.
- ^ "Smer vyhral, mimoparlamentné strany neuspeli | Eurovoľby 2009". volby.sme.sk. Retrieved 8 June 2009.
- ^ "European election results 2009 for Slovenia". Results of the 2009 European Elections. TNS opinion. Archived from the original on 16 January 2016. Retrieved 7 June 2009.
- ^ "Volitve v Evropski parlament 2009". Volitve.gov.si. Archived from the original on 10 June 2009. Retrieved 8 June 2009.
- ^ "European election results 2009 for Spain". Results of the 2009 European Elections. TNS opinion. Archived from the original on 12 June 2009. Retrieved 7 June 2009.
- ^ "Official results for Spain". Spanish Ministry of the Interior. Archived from the original on 9 June 2009. Retrieved 8 June 2009.
- ^ "European election results 2009 for Sweden". Valmyndigheten. Archived from the original on 4 March 2012. Retrieved 11 June 2009.
- ^ "European Election Results 2009, UK Results". BBC News. 19 April 2009. Retrieved 2 May 2010.
- ^ "26th Conservative MEP elected – in Northern Ireland – thetorydiary". Conservativehome.blogs.com. 8 June 2009. Retrieved 15 March 2010.
- ^ "Results of the 2009 European election". Results of the 2009 European Elections. TNS opinion. Archived from the original on 11 June 2009. Retrieved 7 June 2009.
- ^ "Composition of the 2009 European Parliament (historical data)". Archived from the original on 11 June 2009. Retrieved 7 June 2009.
- ^ Valentina Pop (25 November 2009). "Parliament to get extra observer MEPs from 12 countries". EUobserver. Retrieved 15 March 2010.
- ^ "Spain wants seats for 'phantom' MEPs - European Voice". 22 January 2013. Archived from the original on 22 January 2013.
- ^ Incoming / Outgoing. Europarl.europa.eu. Retrieved on 2013-08-24.
- ^ "EU offered timetable for Barroso's successor | EU — European Information on EU Treaty & Institutions". EurActiv.com. 20 March 2009. Archived from the original on 23 March 2009. Retrieved 6 April 2009.
- ^ Andrew Duff (27 May 2008). "European Parliament's political diversity at risk". EUobserver.com. Retrieved 6 April 2009.
- ^ Honor Mahony. "New rules to make it harder for MEPs to form political groups". EUobserver. Retrieved 6 April 2009.
- ^ European Parliament increases threshold to form a political group Archived 2 August 2008 at the Wayback Machine
- ^ "Berlusconi creates rightist bloc". BBC News. 28 March 2009. Retrieved 6 April 2009.
- ^ "Berlusconi win raises hopes, fears in Brussels — EUbusiness.com — business, legal and economic news and information from the European Union". Eubusiness.com. 15 April 2008. Archived from the original on 26 December 2008. Retrieved 6 April 2009.
- ^ Taylor, Simon (17 April 2009). "Fianna Fáil joins Parliament's liberal grouping". European Voice. Archived from the original on 16 January 2016. Retrieved 5 May 2009.
- ^ "European Political Parties (Part II: the parties) [with Poll]: Alliance for the Europe of the Nations". eurotrib.com. 28 December 2006.
- ^ FF 'may switch to the Liberals'—Eh, since when are FF liberals? Archived 17 November 2007 at the Wayback Machine irishelection.com 19 December 2006
- ^ Brusadelli, Stefano (22 November 2008). "Rutelli: caro Veltroni, non-voglio morire socialista". Panorama (in Italian). Archived from the original on 25 March 2014. Retrieved 25 March 2014.
- ^ "Socialist group to change name after EU elections | EU — European Information on EU Elections 09". EurActiv.com. 13 May 2009. Archived from the original on 17 May 2009. Retrieved 29 May 2009.
- ^ Taylor, Simon (23 June 2009). "Socialists formalise new alliance". European Voice. Retrieved 15 March 2010.
- ^ Leduc, Pauline (21 November 2012). "Interview with Antigoni Papadopoulou, member of the European Parliament". Archived from the original on 25 March 2014. Retrieved 25 March 2014.
- ^ "Results of the 2009 European Elections". TNS opinion in collaboration with the European Parliament. 8 July 2009. Archived from the original on 19 June 2009. Retrieved 9 July 2009.
- ^ "News on the Parliament Website". Europa (web portal). Archived from the original on 22 July 2009. Retrieved 15 March 2010.
- ^ "Parliament Website". Europa (web portal). 13 July 2009. Archived from the original on 23 July 2009. Retrieved 15 March 2010.
- ^ "Next EP president to be a Pole?". Brusselsblogger.blogactiv.eu. 22 April 2008. Archived from the original on 12 June 2016. Retrieved 6 April 2009.
- ^ "Press Release". Grahamwatsonmep.org. Archived from the original on 18 February 2016. Retrieved 15 March 2010.
- ^ "GUE-NGL Press Release". Guengl.eu. Archived from the original on 15 January 2010. Retrieved 15 March 2010.
External links
- Section devoted to the election on the European Parliament website
- EurActiv – EU Elections 2009
- NSD: European Election Database – European Parliament Elections Archived 17 February 2019 at the Wayback Machine
- EU Observer – EU Elections 2009
- Euronews – EU Elections 2009
- Guide to European Elections provided by European Alternatives
- About the European Elections 2009 in Ireland
- EU Election 2009 Coverage on BBC
- Pre-election survey, EU27 and by member state
However there has been controversy over the fact the population figures are drawn from residents, rather than citizens, hence countries with larger immigrant populations who cannot vote, such as the UK, benefit more than those with fewer non-voting residents, such as Italy.[1] Italy would have been the greatest loser from the 2007 distribution to the Lisbon system and sought to have the same number of France and the United Kingdom. Italy brought the issue up at talks on the treaty and succeeded in gaining one extra MEP (giving it the same as the UK) while the President of the European Parliament would not be counted as a lawmaker hence keeping the number of MEPs under the 750 seat limit.[2] MEPs also intend to see amendment for the 2014-2019 term well in advance of those elections to take account of demographic changes. It is hoped that this may avoid the political horse trading that occurs when the numbers have to be revised.[3]
Growth in membership
Template:History of apportionment in the European Parliament
References
- ^ Goldirova, Renata (2007-10-12). "Italy seeks to delay MEP seats decision". EU Observer. Retrieved 2007-10-12.
- ^ Goldirova, Renata (2007-10-19). "EU agrees new 'Lisbon Treaty'". EU Observer. Retrieved 2007-10-19.
- ^ Cite error: The named reference
EP comp tabwas invoked but never defined (see the help page).

