Aluminum industry in the United States

The aluminum industry in the United States in 2023 produced 860 thousand metric tons of aluminum from refined metal ore (primary production), at six smelters. In addition, US industry recycled 3.4 million tons of aluminum (so-called secondary production aluminum).[1] Total annual imports of metal and alloy for use in secondary production stood at 2.6 million metric tons in the year to August 2023, with the previous decade seeing a fundamental shift toward recycled production.[2]
Primary production
[edit]In 2014, primary aluminum, which is produced from bauxite, was produced by three companies at nine smelters. Primary aluminum is preferred for high-quality uses such as aircraft. The leader in US production was Alcoa. Also operating multiple primary plants was Century Aluminum.[citation needed]
Primary production volume in 1999 was 3.8 million metric ton and by 2023, it has dropped to an annual volume of 785,000 metric ton.[3] By March 2024, there are four operating plants with a combined yearly capacity of 650,000 metric tons.[3] In 1980, there were approximately 30 smelters in operation in the US.[4] US had a global market share of under 2% of primary aluminum in 2022.[5]
Primary Aluminum Smelters in the US
| Name | Location | Owner | Status and Date |
|---|---|---|---|
| Warrick Plant | Evansville, Indiana | Alcoa | Operating, July 2022[6] |
| Massena Plant | Massena, New York | Alcoa | Operating, April 2014[7] |
| Mt Holly Plant | Mount Holly, South Carolina | Century Aluminum | Operating, December 2014[8] |
| Sebree Plant | Sebree, Kentucky | Century Aluminum | Operating, May 2015[9] |
| Noranda Plant | New Madrid, Missouri | Magnitude 7 Metals | Curtailed, January 2024[10] |
| Hawesville Plant | Hawesville, Kentucky | Century Aluminum | Idled, June 2022[11] |
| Intalco Plant | Ferndale, Washington | Alcoa | Closed, March 2023[12] |
| Ravenswood Plant | Ravenswood, West Virginia | Century Aluminum | Closed, July 2015[13] |
| Ormet Plant | Hannibal, Ohio | Ormet | Closed, August 2014[14] |
| Columbia Falls Plant | Columbia Falls, Montana | Glencore | Closed in March 2015[15][16] |
| St. Lawrence Plant | Massena, New York | Alcoa | Closed |
| Wenatchee Plant | Wenatchee, Washington | Alcoa | Closed |
| Rockdale Plant | Rockdale, Texas | Alcoa | Closed |
Secondary production
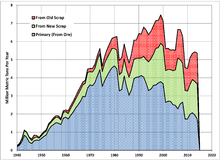
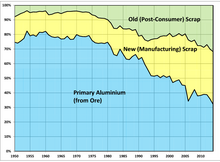
[edit]Secondary production is the recycling of metallic aluminum derived from scrap. Secondary production can be from either new scrap (from aluminum manufacturing), or from old scrap (post-consumer scrap such as recycled aluminum cans).
By 2021, secondary production accounted for 78% of US aluminum production.[17]
Raw materials
[edit]
The principal raw materials for aluminum production are bauxite (for primary production) and scrap (for secondary production).
Primary aluminum production consumes a great deal of electricity, which makes up about a third of the cost. Making a ton of primary aluminum consumes at least 12,500 kW-hr, and most plants consume 14,500 to 15,000 kW-hr per ton of primary aluminum.[18]
Secondary production of a given unit of aluminum requires about 10% of the electricity of primary production.
The United States mined production of bauxite for primary aluminum production is insignificant. In 2013, the US mined only 1.3 percent of the bauxite it used, US mined production being less than 0.1 percent of world production.
International trade
[edit]The US imported nearly all the bauxite (the only commercial aluminum ore) used in producing primary aluminum. For years, the US has produced less than 1% of the bauxite used to make aluminum.
The US also imported 33 percent of the aluminum that was used in 2014. Of the imported aluminum, 63% came from Canada.[1][19]
|
| ||||||||||||||||||||||||||||||||||||||||||||||||||||||||||||||||||||||||||||||||||||||||||||||||||||||||||||||||||||||||||||||||||||||||||||||||||||||||||||||||||||||||||||||||||||||||||||||||||||||||||||||||||||||||||||||||||||||||||||||||||||||||||||||||||||||||||||||||||||||||||||||||||||||||||||||||||||
History of US aluminum production
[edit]The US used to be a much more important factor in the world primary aluminum market. As recently as 1981, the US produced 30% of the world's primary aluminum, and for many years up through 2000, the US was the world's largest producer of primary aluminum. In 2014, by contrast, the US ranked sixth in primary aluminum production, and provided only 3.5% of world production.
US production of primary aluminum peaked in 1980 at 4.64 million metric tons. Since then, US primary aluminum production has fallen by more than half, but secondary production has increased, making up much of the difference. In the 1950s and 1960s, primary production made up about 80% of the aluminum output. In 2014, primary production made up 32%, while secondary from new scrap made up 36% and secondary from old scrap made up 32% of US aluminum production.[1]
Climate impact and market competitiveness
[edit]The development of tools which calculate upfront carbon emissions is expected to bring changes to the relative competitiveness for US-produced aluminum products, and result in states with cleaner electric grids gaining a competitive advantage both for sourcing aluminum construction materials, and for siting of new aluminum industry facilities.[21]
See also
[edit]References
[edit]- ^ a b c Aluminum, US Geological Survey, Mineral Commodity Summary 2023, January 2024.
- ^ US’ shift to recycled aluminium results in crude metal and alloy imports decline till Aug’23, AL Circle, Debanjali Sengupta,13 December 2023.
- ^ a b "Column: US looks to reboot aluminum sector with a new smelter". MINING.COM. March 29, 2024. Retrieved April 28, 2024.
- ^ Boldman, Lane (February 7, 2024). "One of America's last aluminum smelters just closed. Let's rescue Kentucky's from that fate. • Kentucky Lantern". Kentucky Lantern. Retrieved April 28, 2024.
- ^ "America was the world's largest producer of primary aluminum until recently. Now companies are warning the 2% U.S. market share puts the energy transition at risk". Fortune Asia. Retrieved April 28, 2024.
- ^ Alcoa. Alcoa Announces Partial Curtailment at Warrick Smelter in Indiana, Alcoa Press Release, July 1, 2022.
- ^ Lindquist, Brent. Alcoa reacts to tariffs on foreign aluminum , Lynden Tribune, April 11, 2018.
- ^ Wren, David. "Century Aluminum completes acquisition of Mt. Holly facility," Post and Courier, 1 Dec. 2015
- ^ Associated Press, "Union workers locked out at aluminum smelter," Archived July 11, 2015, at the Wayback Machine WBKO, 12 May 2015.
- ^ More than 500 Mag7 employees to lose jobs after Sunday KFVS-12, January 24, 2024
- ^ Miller, Sydney. [1], aluminiuminsider.com, August 21, 2022
- ^ McCarthy, Grace. "Alcoa announces permanent Intalco closure"
- ^ Matics, Greg. "Century Aluminum announces permanent closure of Ravenswood smelting plant," Archived October 24, 2021, at the Wayback Machine Jackson Newspapers, 30 July 2015.
- ^ Milam, John, "Shutdown of Ohio aluminum giant Ormet appears final," People's World, 5 August 2014
- ^ "Columbia Falls Aluminum Co permanently closed," Daily Interlake, 3 March 2015.
- ^ Lundquist, Laura (October 11, 2024). "CSKT demands input on Columbia Falls Superfund cleanup". Missoula Current News. Retrieved October 13, 2024.
- ^ Home, Andy (January 28, 2024). "Column: Another US primary aluminum smelter bites the dust". Reuters.
- ^ Stuart Burns, "Power costs in the production of primary aluminum," Archived 2014-06-09 at the Wayback Machine Metal mIner, 26 Feb. 2009.
- ^ "The Challenges Are Real, but the US Aluminum Industry Can Still Thrive". December 3, 2015. Archived from the original on January 27, 2022. Retrieved April 22, 2021.
- ^ a b "2015 Minerals Yearbook - ALUMINUM [ADVANCE RELEASE]" (PDF). U.S. Geological Survey. Aluminum Statistics and Information
- ^ Sanders, Helen (September 6, 2019). "Carbon Counting: A Driver for U.S. Sourced Aluminum? (Part 2)". Insights and Inspirations. Archived from the original on September 19, 2019. Retrieved December 8, 2019.
