From Wikipedia, the free encyclopedia
1920 Latvian Constitutional Assembly election|
|
|
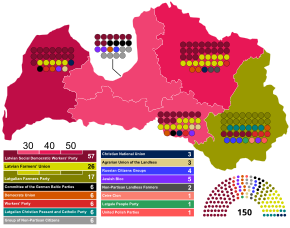
This lists parties that won seats. See the complete results below.  Results by constituency. |
|
Constitutional Assembly elections were held in Latvia on 17 and 18 April 1920.[1] The Latvian Social Democratic Workers' Party emerged as the largest party in the Constitutional Assembly, winning 57 of the 150 seats.[2] The elections were boycotted by communist parties.[3] The Constitutional Assembly was responsible for drafting a constitution, which was approved on 15 February and promulgated on 7 November 1922.[3]
| Party | Votes | % | Seats |
|---|
| Latvian Social Democratic Workers' Party | 274,877 | 38.67 | 57 |
| Latvian Farmers' Union | 126,434 | 17.79 | 26 |
| Latgalian Farmers Party | 72,961 | 10.26 | 17 |
| Committee of the German Baltic Parties | 32,256 | 4.54 | 6 |
| Democrats Union | 29,662 | 4.17 | 6 |
| Workers' Party | 28,117 | 3.96 | 6 |
| Latgalian Christian Peasant and Catholic Party | 26,534 | 3.73 | 6 |
| Group of Non-Partisan Citizens | 23,867 | 3.36 | 6 |
| Christian National Union | 16,218 | 2.28 | 3 |
| Agrarian Union of the Landless | 14,078 | 1.98 | 3 |
| Russian Citizens Groups | 13,651 | 1.92 | 4 |
| Jewish Bloc | 12,764 | 1.80 | 5 |
| Non-Partisan Landless Farmers | 11,180 | 1.57 | 2 |
| Ceire Cion | 8,254 | 1.16 | 1 |
| Latgale People Party | 6,539 | 0.92 | 1 |
| United Polish Parties | 5,525 | 0.78 | 1 |
| List of Lithuanians and Catholics | 2,038 | 0.29 | 0 |
| Working Group of Landless Farmers and Workers | 1,588 | 0.22 | 0 |
| List of Soldier Candidates | 1,497 | 0.21 | 0 |
| Latgalian Folk United Non-Partisan Group | 1,026 | 0.14 | 0 |
| List of Revolutionaries and Socialists | 724 | 0.10 | 0 |
| Women's Union | 436 | 0.06 | 0 |
| Jews of Ludza | 152 | 0.02 | 0 |
| Working Group of Jēkabmiests Village | 87 | 0.01 | 0 |
| Others | 424 | 0.06 | 0 |
| Total | 710,889 | 100.00 | 150 |
|
| Valid votes | 709,004 | 99.73 | |
|---|
| Invalid/blank votes | 1,930 | 0.27 | |
|---|
| Total votes | 710,934 | 100.00 | |
|---|
| Registered voters/turnout | 797,662 | 89.13 | |
|---|
| Source: Nohlen & Stöver[a] |
- ^ The reported number of valid votes was 1,885 less than the total number of votes received by contesting parties.[2]


