1916 United States presidential election in California
| ||||||||||||||||||||||||||
| Turnout | 79.57% (of registered voters) 57.91% (of eligible voters) | |||||||||||||||||||||||||
|---|---|---|---|---|---|---|---|---|---|---|---|---|---|---|---|---|---|---|---|---|---|---|---|---|---|---|
| ||||||||||||||||||||||||||
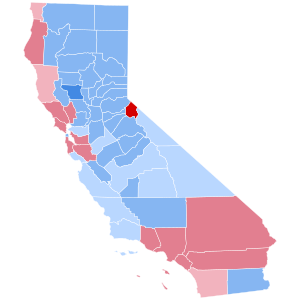
 County Results
| ||||||||||||||||||||||||||
| ||||||||||||||||||||||||||
| Elections in California |
|---|
 |
The 1916 United States presidential election in California took place on November 7, 1916 as part of the 1916 United States presidential election. State voters chose 13 representatives, or electors, to the Electoral College, who voted for president and vice president.
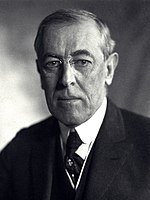
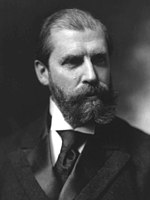
California narrowly voted for the Democratic incumbent, Woodrow Wilson, over the Republican nominee, Associate Justice Charles Evans Hughes.
Although very close, this was not as close as the previous election or the critical 1892 election in California, and was only the third-closest state in a thrilling election behind New Hampshire and Minnesota. As of 2024, no subsequent presidential election in California has been decided by a smaller margin, although California was decided by less than one point in 1948 and 1960. This was the closest result where California's electoral votes were not split.
Following on from breaking half-a-dozen county droughts in 1912, Wilson became the first Democrat to carry Placer County, Plumas County, and Santa Barbara County, since Stephen A. Douglas in 1860, and the first to carry the counties of Contra Costa and Santa Cruz since James Buchanan in 1856.[2] If Hughes had won California, he would have won the Electoral College despite losing the national popular vote by three points. This is the last election in which a Republican candidate carried Los Angeles County but failed to carry the state of California. Until 2020 this had been the most recent election when California would decide the overall winner of a presidential election, despite routinely having among the highest, or highest number of electoral votes after the next reapportionment following the 1930 census. Had Hughes carried the state, he would have been elected with 267 electoral votes to Wilson's 264.
Results
[edit]| Party | Pledged to | Elector | Votes | |
|---|---|---|---|---|
| Democratic Party | Woodrow Wilson | Francis J. Heney | 466,289 | |
| Democratic Party | Woodrow Wilson | Edward L. Doheny | 465,936 | |
| Democratic Party | Woodrow Wilson | Jo V. Snyder | 465,092 | |
| Democratic Party | Woodrow Wilson | Irving C. Ackerman | 464,926 | |
| Democratic Party | Woodrow Wilson | L. F. Puter | 464,824 | |
| Democratic Party | Woodrow Wilson | John F. Barry | 464,808 | |
| Democratic Party | Woodrow Wilson | Oscar Hocks | 464,731 | |
| Democratic Party | Woodrow Wilson | James F. Peck | 464,680 | |
| Democratic Party | Woodrow Wilson | Lorin A. Handley | 464,515 | |
| Democratic Party | Woodrow Wilson | R. F. Del Valle | 464,477 | |
| Democratic Party | Woodrow Wilson | Virginia M. Spinks | 464,233 | |
| Democratic Party | Woodrow Wilson | Mary Marshall Wiley | 464,206 | |
| Democratic Party | Woodrow Wilson | Carrie L. Tyler | 463,709 | |
| Republican Party | Charles Evans Hughes | J. F. Carlston | 462,516 | |
| Republican Party | Charles Evans Hughes | John A. Britton | 462,004 | |
| Republican Party | Charles Evans Hughes | T. S. Montgomery | 461,828 | |
| Republican Party | Charles Evans Hughes | Willis H. Booth | 461,826 | |
| Republican Party | Charles Evans Hughes | W. F. Chandler | 461,610 | |
| Republican Party | Charles Evans Hughes | Albert E. Boynton | 461,588 | |
| Republican Party | Charles Evans Hughes | J. C. Needham | 461,505 | |
| Republican Party | Charles Evans Hughes | Joseph Scott | 461,354 | |
| Republican Party | Charles Evans Hughes | Rudolph J. Taussig | 461,301 | |
| Republican Party | Charles Evans Hughes | Louise Harvey Clarke | 460,941 | |
| Republican Party | Charles Evans Hughes | Mary Roberts Coolidge | 460,908 | |
| Republican Party | Charles Evans Hughes | A. J. Wallace | 460,826 | |
| Republican Party | Charles Evans Hughes | J. P. Baumgartner | 460,821 | |
| Socialist Party | Allan L. Benson | Scott Anderson | 42,898 | |
| Socialist Party | Allan L. Benson | Joseph Bredsteen | 42,562 | |
| Socialist Party | Allan L. Benson | M. P. Christensen | 42,412 | |
| Socialist Party | Allan L. Benson | Mollie Bloom Flagg | 42,394 | |
| Socialist Party | Allan L. Benson | W. Scott Lewis | 42,354 | |
| Socialist Party | Allan L. Benson | Ethel Lynn | 42,330 | |
| Socialist Party | Allan L. Benson | Arnold R. Holston | 42,327 | |
| Socialist Party | Allan L. Benson | C. W. Kingsley | 42,320 | |
| Socialist Party | Allan L. Benson | Noble A. Richardson | 42,312 | |
| Socialist Party | Allan L. Benson | Harry M. McKee | 42,273 | |
| Socialist Party | Allan L. Benson | Ben F. Wilson | 42,263 | |
| Socialist Party | Allan L. Benson | George W. Woodbey | 42,232 | |
| Socialist Party | Allan L. Benson | A. E. Briggs | 42,178 | |
| Prohibition Party | J. Franklin Hanly | Annie E. K. Bidwell | 27,713 | |
| Prohibition Party | J. Franklin Hanly | Horace A. Johnson | 27,408 | |
| Prohibition Party | J. Franklin Hanly | Fred F. Wheeler | 27,208 | |
| Prohibition Party | J. Franklin Hanly | Robert Rogers | 27,156 | |
| Prohibition Party | J. Franklin Hanly | Elam Biggs | 27,116 | |
| Prohibition Party | J. Franklin Hanly | Minnie Goldthwaite | 27,082 | |
| Prohibition Party | J. Franklin Hanly | C. C. Selecman | 27,067 | |
| Prohibition Party | J. Franklin Hanly | Wiley J. Phillips | 27,050 | |
| Prohibition Party | J. Franklin Hanly | A. K. Nash | 27,027 | |
| Prohibition Party | J. Franklin Hanly | Ada E. Ferris | 27,017 | |
| Prohibition Party | J. Franklin Hanly | Walter O. Woolever | 27,013 | |
| Prohibition Party | J. Franklin Hanly | Thomas K. Beard | 26,980 | |
| Prohibition Party | J. Franklin Hanly | C. S. Corkhill | 26,894 | |
| Write-in | Scattering | 187 | ||
| Votes cast[a] | 999,603 | |||
Results by county
[edit]| County | Woodrow Wilson Democratic |
Charles Evans Hughes Republican |
Allan L. Benson Socialist |
J. Franklin Hanly Prohibition |
Scattering Write-in |
Margin | Total votes cast[b] | ||||||
|---|---|---|---|---|---|---|---|---|---|---|---|---|---|
| # | % | # | % | # | % | # | % | # | % | # | % | ||
| Alameda | 43,748 | 42.84% | 51,417 | 50.34% | 5,422 | 5.31% | 1,544 | 1.51% | 0 | 0.00% | -7,669 | -7.51% | 102,131 |
| Alpine | 23 | 27.71% | 60 | 72.29% | 0 | 0.00% | 0 | 0.00% | 0 | 0.00% | -37 | -44.58% | 83 |
| Amador | 1,766 | 56.28% | 1,209 | 38.53% | 125 | 3.98% | 38 | 1.21% | 0 | 0.00% | 557 | 17.75% | 3,138 |
| Butte | 4,888 | 50.55% | 3,956 | 40.91% | 436 | 4.51% | 389 | 4.02% | 0 | 0.00% | 932 | 9.64% | 9,669 |
| Calaveras | 1,524 | 53.06% | 1,175 | 40.91% | 135 | 4.70% | 38 | 1.32% | 0 | 0.00% | 349 | 12.15% | 2,872 |
| Colusa | 1,998 | 62.89% | 1,011 | 31.82% | 123 | 3.87% | 45 | 1.42% | 0 | 0.00% | 987 | 31.07% | 3,177 |
| Contra Costa | 6,092 | 46.82% | 5,731 | 44.05% | 886 | 6.81% | 302 | 2.32% | 0 | 0.00% | 361 | 2.77% | 13,011 |
| Del Norte | 471 | 41.35% | 499 | 43.81% | 144 | 12.64% | 25 | 2.19% | 0 | 0.00% | -28 | -2.46% | 1,139 |
| El Dorado | 1,755 | 57.67% | 1,068 | 35.10% | 187 | 6.15% | 33 | 1.08% | 0 | 0.00% | 687 | 22.58% | 3,043 |
| Fresno | 14,241 | 49.95% | 11,707 | 41.07% | 1,648 | 5.78% | 912 | 3.20% | 0 | 0.00% | 2,534 | 8.89% | 28,508 |
| Glenn | 1,797 | 53.87% | 1,342 | 40.23% | 101 | 3.03% | 94 | 2.82% | 2 | 0.06% | 455 | 13.64% | 3,336 |
| Humboldt | 4,103 | 36.27% | 5,786 | 51.14% | 1,063 | 9.40% | 361 | 3.19% | 0 | 0.00% | -1,683 | 14.88% | 11,313 |
| Imperial | 3,273 | 49.15% | 2,694 | 40.46% | 363 | 5.45% | 329 | 4.94% | 0 | 0.00% | 579 | 8.69% | 6,659 |
| Inyo | 966 | 47.92% | 846 | 41.96% | 152 | 7.54% | 52 | 2.58% | 0 | 0.00% | 120 | 5.95% | 2,016 |
| Kern | 9,566 | 59.86% | 5,611 | 35.11% | 553 | 3.46% | 251 | 1.57% | 0 | 0.00% | 3,955 | 24.75% | 15,981 |
| Kings | 2,905 | 51.86% | 2,221 | 39.65% | 256 | 4.57% | 220 | 3.93% | 0 | 0.00% | 684 | 12.21% | 5,602 |
| Lake | 1,164 | 52.13% | 791 | 35.42% | 182 | 8.15% | 96 | 4.30% | 0 | 0.00% | 373 | 16.70% | 2,233 |
| Lassen | 1,323 | 55.75% | 877 | 36.96% | 143 | 6.03% | 30 | 1.26% | 0 | 0.00% | 446 | 18.79% | 2,373 |
| Los Angeles | 114,070 | 42.58% | 135,554 | 50.59% | 8,076 | 3.01% | 10,061 | 3.76% | 160 | 0.06% | -21,484 | -8.02% | 267,921 |
| Madera | 1,880 | 54.01% | 1,323 | 38.01% | 183 | 5.26% | 86 | 2.56% | 6 | 0.17% | 557 | 16.00% | 3,481 |
| Marin | 3,789 | 43.82% | 4,328 | 50.05% | 424 | 4.90% | 106 | 1.23% | 0 | 0.00% | -539 | -6.23% | 8,647 |
| Mariposa | 802 | 58.24% | 451 | 32.75% | 95 | 6.90% | 29 | 2.11% | 0 | 0.00% | 351 | 25.49% | 1,377 |
| Mendocino | 3,371 | 45.14% | 3,494 | 46.79% | 453 | 6.07% | 150 | 2.01% | 0 | 0.00% | -123 | -1.65% | 7,468 |
| Merced | 2,637 | 50.36% | 2,132 | 40.72% | 285 | 5.44% | 182 | 3.48% | 0 | 0.00% | 505 | 9.64% | 5,236 |
| Modoc | 1,222 | 58.25% | 768 | 36.61% | 79 | 3.77% | 29 | 1.38% | 0 | 0.00% | 454 | 21.64% | 2,098 |
| Mono | 158 | 48.47% | 137 | 42.02% | 26 | 7.98% | 5 | 1.53% | 0 | 0.00% | 21 | 6.44% | 326 |
| Monterey | 3,878 | 48.28% | 3,599 | 44.81% | 364 | 4.53% | 191 | 2.38% | 0 | 0.00% | 279 | 3.47% | 8,032 |
| Napa | 3,088 | 41.39% | 3,914 | 52.46% | 304 | 4.07% | 155 | 2.08% | 0 | 0.00% | -826 | -11.07% | 7,461 |
| Nevada | 2,548 | 56.58% | 1,586 | 35.22% | 279 | 6.20% | 90 | 2.00% | 0 | 0.00% | 962 | 21.36% | 4,503 |
| Orange | 6,474 | 34.54% | 10,609 | 56.59% | 643 | 3.43% | 1,020 | 5.44% | 0 | 0.00% | -4,135 | -22.06% | 18,746 |
| Placer | 3,375 | 58.28% | 1,954 | 33.74% | 314 | 5.42% | 148 | 2.56% | 0 | 0.00% | 1,421 | 24.54% | 5,791 |
| Plumas | 1,025 | 56.50% | 663 | 36.55% | 102 | 5.62% | 24 | 1.32% | 0 | 0.00% | 362 | 19.96% | 1,814 |
| Riverside | 4,561 | 33.44% | 7,452 | 54.64% | 790 | 5.79% | 836 | 6.13% | 0 | 0.00% | -2,891 | -21.20% | 13,639 |
| Sacramento | 14,538 | 54.63% | 10,696 | 40.19% | 833 | 3.13% | 546 | 2.05% | 0 | 0.00% | 3,842 | 14.44% | 26,613 |
| San Benito | 1,688 | 51.80% | 1,440 | 44.19% | 91 | 2.79% | 40 | 1.23% | 0 | 0.00% | 248 | 7.61% | 3,259 |
| San Bernardino | 9,398 | 39.92% | 11,932 | 50.68% | 805 | 3.42% | 1,410 | 5.99% | 0 | 0.00% | -2,534 | -10.76% | 23,545 |
| San Diego | 16,815 | 46.02% | 16,978 | 46.47% | 1,612 | 4.41% | 1,132 | 3.10% | 0 | 0.00% | -163 | -0.45% | 36,537 |
| San Francisco | 78,225 | 52.45% | 63,093 | 42.30% | 6,423 | 4.31% | 1,404 | 0.94% | 7 | 0.00% | 15,132 | 10.15% | 149,152 |
| San Joaquin | 11,454 | 55.44% | 7,861 | 38.05% | 789 | 3.82% | 557 | 2.70% | 0 | 0.00% | 3,593 | 17.39% | 20,661 |
| San Luis Obispo | 3,539 | 49.85% | 2,854 | 40.20% | 547 | 7.71% | 159 | 2.24% | 0 | 0.00% | 685 | 9.65% | 7,099 |
| San Mateo | 4,485 | 43.08% | 5,207 | 50.01% | 540 | 5.19% | 179 | 1.72% | 0 | 0.00% | -722 | -6.93% | 10,411 |
| Santa Barbara | 5,198 | 49.65% | 4,453 | 42.54% | 470 | 4.49% | 347 | 3.31% | 1 | 0.01% | 745 | 7.12% | 10,469 |
| Santa Clara | 14,185 | 43.40% | 16,592 | 50.77% | 1,006 | 3.08% | 887 | 2.71% | 11 | 0.03% | -2,407 | -7.37% | 32,681 |
| Santa Cruz | 4,511 | 47.76% | 4,228 | 44.76% | 383 | 4.05% | 324 | 3.43% | 0 | 0.00% | 283 | 3.00% | 9,446 |
| Shasta | 2,828 | 52.39% | 2,008 | 37.20% | 449 | 8.32% | 113 | 2.09% | 0 | 0.00% | 820 | 15.19% | 5,398 |
| Sierra | 594 | 58.35% | 360 | 35.36% | 55 | 5.40% | 9 | 0.88% | 0 | 0.00% | 234 | 22.99% | 1,018 |
| Siskiyou | 3,447 | 57.15% | 2,059 | 34.13% | 417 | 6.91% | 109 | 1.81% | 0 | 0.00% | 1,388 | 23.01% | 6,032 |
| Solano | 5,678 | 58.37% | 3,536 | 36.35% | 322 | 3.31% | 192 | 1.97% | 0 | 0.00% | 2,142 | 22.02% | 9,728 |
| Sonoma | 8,377 | 43.35% | 9,733 | 50.37% | 921 | 4.77% | 293 | 1.52% | 0 | 0.00% | -1,356 | -7.02% | 19,324 |
| Stanislaus | 5,490 | 46.98% | 4,401 | 37.66% | 729 | 6.24% | 1,067 | 9.13% | 0 | 0.00% | 1,089 | 9.32% | 11,687 |
| Sutter | 1,543 | 53.52% | 1,211 | 42.00% | 80 | 2.77% | 49 | 1.70% | 0 | 0.00% | 332 | 11.52% | 2,883 |
| Tehama | 2,534 | 52.92% | 1,739 | 36.32% | 334 | 6.98% | 181 | 3.78% | 0 | 0.00% | 795 | 16.60% | 4,788 |
| Trinity | 661 | 54.81% | 424 | 35.16% | 104 | 8.62% | 17 | 1.41% | 0 | 0.00% | 237 | 19.65% | 1,206 |
| Tulare | 7,299 | 46.87% | 6,845 | 43.96% | 895 | 5.75% | 533 | 3.42% | 0 | 0.00% | 454 | 2.92% | 15,572 |
| Tuolumne | 1,584 | 54.21% | 1,057 | 36.17% | 237 | 8.11% | 44 | 1.51% | 0 | 0.00% | 527 | 18.04% | 2,922 |
| Ventura | 2,835 | 39.30% | 3,980 | 55.18% | 260 | 3.60% | 138 | 1.91% | 0 | 0.00% | -1,145 | -15.87% | 7,213 |
| Yolo | 2,922 | 53.12% | 2,334 | 42.43% | 167 | 3.04% | 78 | 1.42% | 0 | 0.00% | 588 | 10.69% | 5,501 |
| Yuba | 1,980 | 54.49% | 1,530 | 42.10% | 93 | 2.56% | 31 | 0.85% | 0 | 0.00% | 450 | 12.38% | 3,634 |
| Total | 466,289 | 46.65% | 462,516 | 46.27% | 42,898 | 4.29% | 27,713 | 2.77% | 187 | 0.02% | 3,773 | 0.38% | 999,603 |
Counties that flipped from Republican to Democratic
[edit]Counties that flipped from Democratic to Republican
[edit]Notes
[edit]References
[edit]- ^ "Historical Voter Registration and Participation in Statewide General Elections 1910-2018" (PDF). California Secretary of State. Retrieved May 5, 2022.
- ^ Menendez, Albert J.; The Geography of Presidential Elections in the United States, 1868-2004, pp. 153-155 ISBN 0786422173
- ^ Statement of Vote at General Election held on November 7, 1916 in the State of California. Sacramento, California. 1968. pp. 8–15. Retrieved July 15, 2024.
{{cite book}}: CS1 maint: location missing publisher (link)


