Southwark South East (UK Parliament constituency)
| Southwark South East | |
|---|---|
| Former borough constituency for the House of Commons | |
| 1918–1950 | |
| Seats | one |
| Created from | Walworth |
| Replaced by | Southwark |
Southwark (Br [ˈsʌðɨk])[1] South East was a parliamentary constituency in the Metropolitan Borough of Southwark, in South London. It returned one Member of Parliament (MP) to the House of Commons of the Parliament of the United Kingdom.


The constituency was created for the 1918 general election, and abolished for the 1950 general election, when it was largely replaced by the new Southwark constituency.
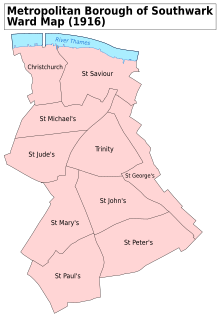
The constituency comprised the wards of St. George, St. John and St. Peter. It covered most of East Walworth and Faraday wards, together with a sliver of Grange ward, in the modern day London Borough of Southwark.
Members of Parliament
[edit]| Election | Member | Party | |
|---|---|---|---|
| 1918 | James Arthur Dawes | Coalition Liberal | |
| 1921 by-election | Thomas Naylor | Labour | |
| 1922 | Maurice Alexander | National Liberal | |
| 1923 | Thomas Naylor | Labour | |
| 1931 | George Powell | Conservative | |
| 1935 | Thomas Naylor | Labour | |
| 1950 | constituency abolished | ||
Elections
[edit]Elections in the 1910s
[edit]
| Party | Candidate | Votes | % | ±% | |
|---|---|---|---|---|---|
| C | Liberal | James Arthur Dawes | 7,208 | 72.6 | |
| Labour | Thomas Naylor | 2,718 | 27.4 | ||
| Majority | 4,490 | 45.2 | |||
| Turnout | 9,926 | ||||
| Liberal win (new seat) | |||||
| C indicates candidate endorsed by the coalition government. | |||||
Elections in the 1920s
[edit]
| Party | Candidate | Votes | % | ±% | |
|---|---|---|---|---|---|
| Labour | Thomas Naylor | 6,561 | 57.0 | +29.6 | |
| National Liberal | Thomas Owen Jacobsen | 2,636 | 22.9 | −49.7 | |
| Ind. Unionist | Horace Louis Petit Boot | 2,307 | 20.1 | New | |
| Majority | 3,925 | 34.1 | N/A | ||
| Turnout | 11,504 | 38.5 | −6.7 | ||
| Labour gain from National Liberal | Swing | +39.6 | |||

| Party | Candidate | Votes | % | ±% | |
|---|---|---|---|---|---|
| National Liberal | Maurice Alexander | 10,014 | 56.4 | N/A | |
| Labour | Thomas Naylor | 7,734 | 43.6 | +16.2 | |
| Majority | 2,280 | 12.8 | N/A | ||
| Turnout | 17,748 | 58.2 | |||
| National Liberal gain from Labour | Swing | ||||
| Party | Candidate | Votes | % | ±% | |
|---|---|---|---|---|---|
| Labour | Thomas Naylor | 9,374 | 54.3 | +10.7 | |
| Liberal | Maurice Alexander | 7,884 | 45.7 | −10.7 | |
| Majority | 1,490 | 8.6 | N/A | ||
| Turnout | 17,258 | 55.7 | −2.5 | ||
| Labour gain from Liberal | Swing | +10.7 | |||

| Party | Candidate | Votes | % | ±% | |
|---|---|---|---|---|---|
| Labour | Thomas Naylor | 11,635 | 54.3 | 0.0 | |
| Unionist | Geoffrey Lloyd | 7,387 | 34.5 | New | |
| Liberal | Elsie Elias | 2,388 | 11.2 | −34.5 | |
| Majority | 4,248 | 19.8 | +11.2 | ||
| Turnout | 21,410 | 68.1 | +8.4 | ||
| Labour hold | Swing | ||||
| Party | Candidate | Votes | % | ±% | |
|---|---|---|---|---|---|
| Labour | Thomas Naylor | 13,527 | 60.4 | +6.1 | |
| Liberal | William John Squire | 4,766 | 21.3 | +10.1 | |
| Unionist | Evelyn George Harcourt Powell | 4,086 | 18.3 | −16.2 | |
| Majority | 8,761 | 39.1 | +19.3 | ||
| Turnout | 22,379 | 58.9 | −9.2 | ||
| Labour hold | Swing | -2.0 | |||
Elections in the 1930s
[edit]| Party | Candidate | Votes | % | ±% | |
|---|---|---|---|---|---|
| Conservative | Evelyn George Harcourt Powell | 11,063 | 53.3 | +35.0 | |
| Labour | Thomas Naylor | 9,678 | 46.7 | −13.7 | |
| Majority | 1,385 | 6.6 | N/A | ||
| Turnout | 20,741 | 54.1 | −4.8 | ||
| Conservative gain from Labour | Swing | ||||
| Party | Candidate | Votes | % | ±% | |
|---|---|---|---|---|---|
| Labour | Thomas Naylor | 11,942 | 63.2 | +16.5 | |
| Conservative | Evelyn George Harcourt Powell | 6,945 | 36.8 | −16.5 | |
| Majority | 4,997 | 26.4 | +19.8 | ||
| Turnout | 18,887 | 53.3 | −0.8 | ||
| Labour gain from Conservative | Swing | ||||
General Election 1939–40
Another General Election was required to take place before the end of 1940. The political parties had been making preparations for an election to take place and by the Autumn of 1939, the following candidates had been selected;
- Labour: Thomas Naylor[9]
- Conservative:
Elections in the 1940s
[edit]| Party | Candidate | Votes | % | ±% | |
|---|---|---|---|---|---|
| Labour | Thomas Naylor | 9,599 | 76.9 | +13.7 | |
| Conservative | James Greenwood | 2,881 | 23.1 | −13.7 | |
| Majority | 6,718 | 53.8 | +27.4 | ||
| Turnout | 12,480 | 60.8 | +7.5 | ||
| Labour hold | Swing | ||||
References
[edit]- ^ "Southwark", in The Columbia Lippincott Gazetteer of the World (1952), New York: Columbia University Press.
- ^ British Parliamentary Election Results 1918-1949, FWS Craig
- ^ British Parliamentary Election Results 1918-1949, FWS Craig
- ^ British Parliamentary Election Results 1918-1949, FWS Craig
- ^ British Parliamentary Election Results 1918-1949, FWS Craig
- ^ British Parliamentary Election Results 1918-1949, FWS Craig
- ^ British Parliamentary Election Results 1918-1949, FWS Craig
- ^ British Parliamentary Election Results 1918-1949, FWS Craig
- ^ Report of the Annual Conference of the Labour Party, 1939
- ^ British Parliamentary Election Results 1918-1949, FWS Craig
- Leigh Rayment's Historical List of MPs – Constituencies beginning with "S" (part 4)
- Craig, F. W. S. (1983) [1969]. British parliamentary election results 1918–1949 (3rd ed.). Chichester: Parliamentary Research Services. p. 50. ISBN 0-900178-06-X.
