Jump to content

File:Births and deaths per year (1950-2100).svg

Page contents not supported in other languages.
This is a file from the Wikimedia Commons
From Wikipedia, the free encyclopedia

Original file (SVG file, nominally 512 × 362 pixels, file size: 58 KB)

Summary

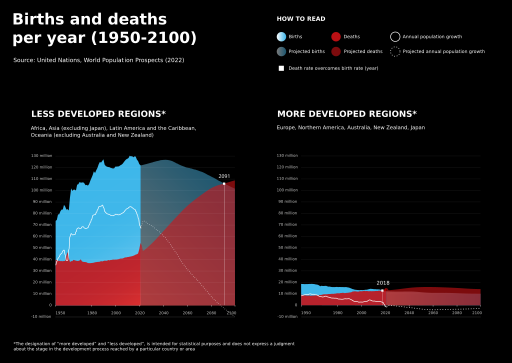
Description
English: Contrary to popular belief, global population growth is not exponential. Although the overall population is still increasing, the peak of growth occurred in the 1960s when it exceeded 2% annually. Since then, growth rates have dropped by more than half, now is below 1%. The United Nations predicts this decline will continue, and by the end of the century, we may see negative growth, meaning a global population decrease rather than an increase.

The designation of “more developed” and “less developed”, is intended for statistical purposes and does not express a judgment about the stage in the development process reached by a particular country or area.

SOURCES UN, World Population Prospects (2022) United Nations, Department of Economic and Social Affairs, Population Division (2022). World Population Prospects 2022, Online Edition. https://population.un.org/wpp/Download/

World Population Prospects 2022 is the 27th edition of the official estimates and projections of the global population that have been published by the United Nations since 1951. The estimates are based on all available sources of data on population size and levels of fertility, mortality and international migration for 237 countries or areas. More details at https://population.un.org/wpp/Publications/.

OurWorldInData.org/population-growth/
Date
Source Own work
Author Francesca Mattiacci


Licensing

I, the copyright holder of this work, hereby publish it under the following license:
w:en:Creative Commons
attribution share alike
This file is licensed under the Creative Commons Attribution-Share Alike 4.0 International license.
You are free:
  • to share – to copy, distribute and transmit the work
  • to remix – to adapt the work
Under the following conditions:
  • attribution – You must give appropriate credit, provide a link to the license, and indicate if changes were made. You may do so in any reasonable manner, but not in any way that suggests the licensor endorses you or your use.
  • share alike – If you remix, transform, or build upon the material, you must distribute your contributions under the same or compatible license as the original.

Captions

Population growth projection until 2100, by continent

Items portrayed in this file

depicts

1 October 2023

image/svg+xml

08998e7e73e401a825017be56cfbfaeeb5f3ff2c

59,074 byte

362 pixel

512 pixel

File history

Click on a date/time to view the file as it appeared at that time.

Date/TimeThumbnailDimensionsUserComment
current00:55, 5 October 2023Thumbnail for version as of 00:55, 5 October 2023512 × 362 (58 KB)Francesca MattiacciClearer visualization, clustered for development stage of regions and not continent as before.
07:24, 2 October 2023Thumbnail for version as of 07:24, 2 October 2023512 × 724 (719 KB)Francesca MattiacciFixed a data about Northern America peak year
23:18, 1 October 2023Thumbnail for version as of 23:18, 1 October 2023512 × 724 (718 KB)Francesca MattiacciBigger size of continents titles, for a better readability
23:09, 1 October 2023Thumbnail for version as of 23:09, 1 October 2023512 × 724 (710 KB)Francesca MattiacciUploaded own work with UploadWizard

The following page uses this file:

Metadata