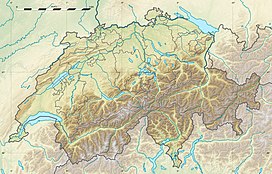
Cimetta
Appearance
(Redirected from Cardada)
| Cimetta | |
|---|---|
 Radio relay tower on the top | |
| Highest point | |
| Elevation | 1,671 m (5,482 ft) |
| Prominence | 61 m (200 ft)[1] |
| Coordinates | 46°12′03″N 8°47′27.8″E / 46.20083°N 8.791056°E |
| Geography | |
| Parent range | Lepontine Alps |
| Climbing | |
| Easiest route | Aerial tramway |
Cimetta is a mountain in the Lepontine Alps, it is located above Locarno and Lake Maggiore.
The Locarno–Madonna del Sasso funicular links Locarno city centre with Orselina. From there a cable car connects to Cardada, from which a chair lift runs to the summit.
Climate
[edit]| Climate data for Cimetta, elevation 1,661 m (5,449 ft), (1991–2020) | |||||||||||||
|---|---|---|---|---|---|---|---|---|---|---|---|---|---|
| Month | Jan | Feb | Mar | Apr | May | Jun | Jul | Aug | Sep | Oct | Nov | Dec | Year |
| Mean daily maximum °C (°F) | 1.5 (34.7) |
1.5 (34.7) |
4.2 (39.6) |
7.5 (45.5) |
12.3 (54.1) |
16.0 (60.8) |
18.3 (64.9) |
18.1 (64.6) |
13.9 (57.0) |
9.8 (49.6) |
4.9 (40.8) |
2.2 (36.0) |
9.2 (48.6) |
| Daily mean °C (°F) | −1.1 (30.0) |
−1.3 (29.7) |
0.9 (33.6) |
3.7 (38.7) |
7.9 (46.2) |
11.8 (53.2) |
14.0 (57.2) |
13.9 (57.0) |
9.9 (49.8) |
6.3 (43.3) |
2.1 (35.8) |
−0.4 (31.3) |
5.6 (42.1) |
| Mean daily minimum °C (°F) | −3.6 (25.5) |
−3.7 (25.3) |
−1.5 (29.3) |
1.1 (34.0) |
5.2 (41.4) |
9.1 (48.4) |
11.2 (52.2) |
11.3 (52.3) |
7.6 (45.7) |
4.1 (39.4) |
0.0 (32.0) |
−2.7 (27.1) |
3.2 (37.8) |
| Average precipitation mm (inches) | 48.6 (1.91) |
50.0 (1.97) |
72.7 (2.86) |
131.7 (5.19) |
179.4 (7.06) |
178.1 (7.01) |
147.4 (5.80) |
193.5 (7.62) |
188.9 (7.44) |
196.3 (7.73) |
159.3 (6.27) |
63.5 (2.50) |
1,609.4 (63.36) |
| Average precipitation days (≥ 1.0 mm) | 5.6 | 5.2 | 6.6 | 10.2 | 12.4 | 10.6 | 9.8 | 10.9 | 9.3 | 10.1 | 10.2 | 7.0 | 107.9 |
| Average relative humidity (%) | 58 | 59 | 63 | 69 | 72 | 73 | 72 | 74 | 77 | 74 | 67 | 59 | 68 |
| Mean monthly sunshine hours | 160.1 | 168.2 | 206.4 | 187.7 | 200.7 | 228.0 | 258.1 | 235.6 | 181.9 | 156.3 | 130.8 | 142.0 | 2,255.8 |
| Percent possible sunshine | 61 | 61 | 58 | 48 | 46 | 52 | 58 | 57 | 51 | 49 | 50 | 57 | 54 |
| Source 1: NOAA[2] | |||||||||||||
| Source 2: MeteoSwiss[3] | |||||||||||||
See also
[edit]References
[edit]- ^ Swisstopo maps
- ^ "World Meteorological Organization Climate Normals for 1991–2020". World Meteorological Organization Climatological Standard Normals (1991–2020). National Oceanic and Atmospheric Administration. Archived from the original on 11 December 2024. Retrieved 11 December 2024.
- ^ "Climate Normals Cimetta (Reference period 1991−2020)" (PDF). Swiss Federal Office of Meteorology and Climatology, MeteoSwiss. 13 January 2022. Retrieved 13 January 2022.
External links
[edit]

