Arctic sea ice decline
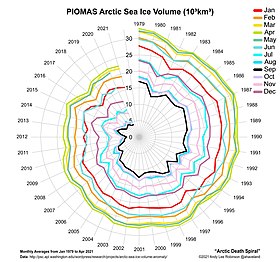
Sea ice in the Arctic region has declined in recent decades in area and volume due to climate change. It has been melting more in summer than it refreezes in winter. Global warming, caused by greenhouse gas forcing is responsible for the decline in Arctic sea ice. The decline of sea ice in the Arctic has been accelerating during the early twenty-first century, with a decline rate of 4.7% per decade (it has declined over 50% since the first satellite records).[1][2][3] Summertime sea ice will likely cease to exist sometime during the 21st century.[4]
The region is at its warmest in at least 4,000 years.[5] Furthermore, the Arctic-wide melt season has lengthened at a rate of five days per decade (from 1979 to 2013), dominated by a later autumn freeze-up.[6] The IPCC Sixth Assessment Report (2021) stated that Arctic sea ice area will likely drop below 1 million km2 in at least some Septembers before 2050.[7]: 1249 In September 2020, the US National Snow and Ice Data Center reported that the Arctic sea ice in 2020 had melted to an extent of 3.74 million km2, its second-smallest extent since records began in 1979.[8] Earth lost 28 trillion tonnes of ice between 1994 and 2017, with Arctic sea ice accounting for 7.6 trillion tonnes of this loss. The rate of ice loss has risen by 57% since the 1990s.[9]
Sea ice loss is one of the main drivers of Arctic amplification, the phenomenon that the Arctic warms faster than the rest of the world under climate change. It is plausible that sea ice decline also makes the jet stream weaker, which would cause more persistent and extreme weather in mid-latitudes.[10][11] Shipping is more often possible in the Arctic now, and will likely increase further. Both the disappearance of sea ice and the resulting possibility of more human activity in the Arctic Ocean pose a risk to local wildlife such as polar bears.
One important aspect in understanding sea ice decline is the Arctic dipole anomaly. This phenomenon appears to have slowed down the overall loss of sea ice between 2007 and 2021, but such a trend will probably not continue.[12][13]
Definitions
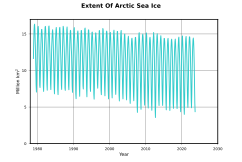
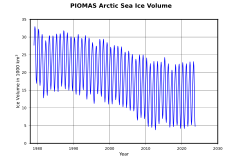
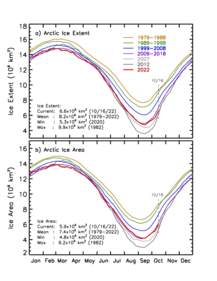
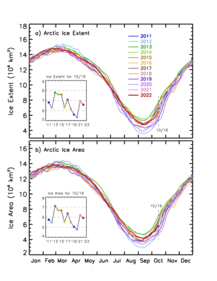
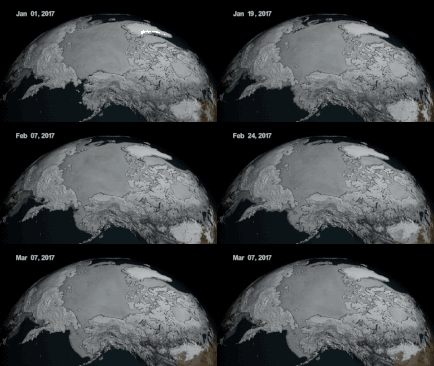
[edit]The Arctic Ocean is the mass of water positioned approximately above latitude 65° N. Arctic Sea Ice refers to the area of the Arctic Ocean covered by ice. The Arctic sea ice minimum is the day in a given year when Arctic sea ice reaches its smallest extent, occurring at the end of the summer melting season, normally during September. Arctic Sea ice maximum is the day of a year when Arctic sea ice reaches its largest extent near the end of the Arctic cold season, normally during March.[14] Typical data visualizations for Arctic sea ice include average monthly measurements or graphs for the annual minimum or maximum extent, as shown in the adjacent images.
Sea ice extent is defined as the area with at least 15% of sea ice cover; it is more often used as a metric than simple total sea ice area. This metric is used to address uncertainty in distinguishing open sea water from melted water on top of solid ice, which satellite detection methods have difficulty differentiating. This is primarily an issue in summer months.
Observations
[edit]A 2007 study found the decline to be "faster than forecasted" by model simulations.[15] A 2011 study suggested that it could be reconciled by internal variability enhancing the greenhouse gas-forced sea ice decline over the last few decades.[16] A 2012 study, with a newer set of simulations, also projected rates of retreat that were somewhat less than that actually observed.[17]
Satellite era
[edit]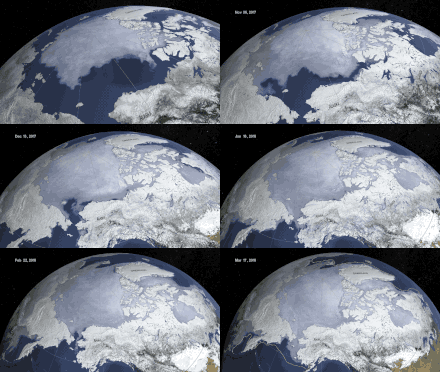
Observation with satellites shows that Arctic sea ice area, extent, and volume have been in decline for a few decades.[18] The amount of multi-year sea ice in the Arctic has declined considerably in recent decades. In 1988, ice that was at least 4 years old accounted for 26% of the Arctic's sea ice. By 2013, ice that age was only 7% of all Arctic sea ice.[19]
Scientists recently measured sixteen-foot (five-meter) wave heights during a storm in the Beaufort Sea in mid-August until late October 2012. This is a new phenomenon for the region, since a permanent sea ice cover normally prevents wave formation. Wave action breaks up sea ice, and thus could become a feedback mechanism, driving sea ice decline.[20]
For January 2016, the satellite-based data showed the lowest overall Arctic sea ice extent of any January since records began in 1979. Bob Henson from Wunderground noted:
Hand in hand with the skimpy ice cover, temperatures across the Arctic have been extraordinarily warm for midwinter. Just before New Year's, a slug of mild air pushed temperatures above freezing to within 200 miles of the North Pole. That warm pulse quickly dissipated, but it was followed by a series of intense North Atlantic cyclones that sent very mild air poleward, in tandem with a strongly negative Arctic oscillation during the first three weeks of the month.[21]
January 2016's remarkable phase transition of Arctic oscillation was driven by a rapid tropospheric warming in the Arctic, a pattern that appears to have increased surpassing the so-called stratospheric sudden warming.[22] The previous record of the lowest extent of the Arctic Ocean covered by ice in 2012 saw a low of 1.31 million square miles (3.387 million square kilometers). This replaced the previous record set on September 18, 2007, at 1.61 million square miles (4.16 million square kilometers). The minimum extent on 18th Sept 2019 was 1.60 million square miles (4.153 million square kilometers). [23]
A 2018 study of the thickness of sea ice found a decrease of 66% or 2.0 m over the last six decades and a shift from permanent ice to largely seasonal ice cover.[24]
Earlier data
[edit]The overall trend indicated in the passive microwave record from 1978 through mid-1995 shows that the extent of Arctic sea ice is decreasing 2.7% per decade.[25] Subsequent work with the satellite passive-microwave data indicates that from late October 1978 through the end of 1996 the extent of Arctic sea ice decreased by 2.9% per decade.[26] Sea ice extent for the Northern Hemisphere showed a decrease of 3.8% ± 0.3% per decade from November 1978 to December 2012.[27]
Future ice loss
[edit]An "ice-free" Arctic Ocean, sometimes referred to as a "blue ocean event" (BOE),[28] is often defined as "having less than 1 million square kilometers of sea ice", because it is very difficult to melt the thick ice around the Canadian Arctic Archipelago.[29][30][31] The IPCC AR5 defines "nearly ice-free conditions" as a sea ice extent of less than 106 km2 for at least five consecutive years.[32]
Estimating the exact year when the Arctic Ocean will become "ice-free" is very difficult, due to the large role of interannual variability in sea ice trends. In Overland and Wang (2013), the authors investigated three different ways of predicting future sea ice levels. They noted that the average of all models used in 2013 was decades behind the observations, and only the subset of models with the most aggressive ice loss was able to match the observations. However, the authors cautioned that there is no guarantee those models would continue to match the observations, and hence that their estimate of ice-free conditions first appearing in 2040s may still be flawed. Thus, they advocated for the use of expert judgement in addition to models to help predict ice-free Arctic events, but they noted that expert judgement could also be done in two different ways: directly extrapolating ice loss trends (which would suggest an ice-free Arctic in 2020) or assuming a slower decline trend punctuated by the occasional "big melt" seasons (such as those of 2007 and 2012) which pushes back the date to 2028 or further into 2030s, depending on the starting assumptions about the timing and the extent of the next "big melt".[33][34] Consequently, there has been a recent history of competing projections from climate models and from individual experts.
Climate models
[edit]A 2006 paper examined projections from the Community Climate System Model and predicted "near ice-free September conditions by 2040".[35]
A 2009 paper from Muyin Wang and James E. Overland applied observational constraints to the projections from six CMIP3 climate models and estimated nearly ice-free Arctic Ocean around September 2037, with a chance it could happen as early as 2028.[36] In 2012, this pair of researchers repeated the exercise with CMIP5 models and found that under the highest-emission scenario in CMIP5, Representative Concentration Pathway 8.5, ice-free September first occurs between 14 and 36 years after the baseline year of 2007, with the median of 28 years (i.e. around 2035).[37]
In 2009, a study using 18 CMIP3 climate models found that they project ice-free Arctic a little before 2100 under a scenario of medium future greenhouse gas emissions.[38] In 2012, a different team used CMIP5 models and their moderate emission scenario, RCP 4.5 (which represents somewhat lower emissions than the scenario in CMIP3), and found that while their mean estimate avoids ice-free Arctic before the end of the century, ice-free conditions in 2045 were within one standard deviation of the mean.[39]
In 2013, a study compared projections from the best-performing subset of CMIP5 models with the output from all 30 models after it was constrained by the historical ice conditions, and found good agreement between these approaches. Altogether, it projected ice-free September between 2054 and 2058 under RCP 8.5, while under RCP 4.5, Arctic ice gets very close to the ice-free threshold in 2060s, but does not cross it by the end of the century, and stays at an extent of 1.7 million km2.[39]
In 2014, IPCC Fifth Assessment Report indicated a risk of ice-free summer around 2050 under the scenario of highest possible emissions.[32]
The Third U.S. National Climate Assessment (NCA), released May 6, 2014, reported that the Arctic Ocean is expected to be ice free in summer before mid-century. Models that best match historical trends project a nearly ice-free Arctic in the summer by the 2030s.[40][41]
In 2021, the IPCC Sixth Assessment Report assessed that there is "high confidence" that the Arctic Ocean will likely become practically ice-free in September before the year 2050 under all SSP scenarios.[7]: 1247–1251
A paper published in 2021 shows that the CMIP6 models which perform the best at simulating Arcic sea ice trends project the first ice-free conditions around 2035 under SSP5-8.5, which is the scenario of continually accelerating greenhouse gas emissions.[42]
By weighting multiple CMIP6 projections, the first year of an ice-free Arctic is likely to occur during 2040–2072 under the SSP3-7.0 scenario.[43]
Impacts on the physical environment
[edit]Global climate change
[edit]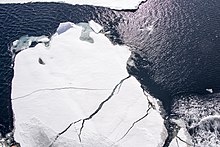
Arctic sea ice maintains the cool temperature of the polar regions and it has an important albedo effect on the climate. Its bright shiny surface reflects sunlight during the Arctic summer; dark ocean surface exposed by the melting ice absorbs more sunlight and becomes warmer, which increases the total ocean heat content and helps to drive further sea ice loss during the melting season, as well as potentially delaying its recovery during the polar night. Arctic ice decline between 1979 and 2011 is estimated to have been responsible for as much radiative forcing as a quarter of CO2 emissions the same period,[45] which is equivalent to around 10% of the cumulative CO2 increase since the start of the Industrial Revolution. When compared to the other greenhouse gases, it has had the same impact as the cumulative increase in nitrous oxide, and nearly half of the cumulative increase in methane concentrations.[46]
The effect of Arctic sea ice decline on global warming will intensify in the future as more and more ice is lost. This feedback has been accounted for by all CMIP5 and CMIP6 models,[47] and it is included in all warming projections they make, such as the estimated warming by 2100 under each Representative Concentration Pathway and Shared Socioeconomic Pathway. They are also capable of resolving the second-order effects of sea ice loss, such as the effect on lapse rate feedback, the changes in water vapor concentrations and regional cloud feedbacks.[48]
Ice-free summer vs. ice-free winter
[edit]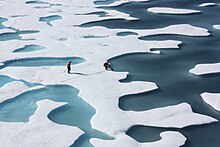
In 2021, the IPCC Sixth Assessment Report said with high confidence that there is no hysteresis and no tipping point in the loss of Arctic summer sea ice.[7]: 1247–1251 This can be explained by the increased influence of stabilizing feedback compared to the ice albedo feedback. Specifically, thinner sea ice leads to increased heat loss in the winter, creating a negative feedback loop. This counteracts the positive ice albedo feedback. As such, sea ice would recover even from a true ice-free summer during the winter, and if the next Arctic summer is less warm, it may avoid another ice-free episode until another similarly warm year down the line. However, higher levels of global warming would delay the recovery from ice-free episodes and make them occur more often and earlier in the summer. A 2018 paper estimated that an ice-free September would occur once in every 40 years under a global warming of 1.5 degrees Celsius, but once in every 8 years under 2 degrees and once in every 1.5 years under 3 degrees.[49]
Very high levels of global warming could eventually prevent Arctic sea ice from reforming during the Arctic winter. This is known as an ice-free winter, and it ultimately amounts to a total of loss of Arctic ice throughout the year. A 2022 assessment found that unlike an ice-free summer, it may represent an irreversible tipping point. It estimated that it is most likely to occur at around 6.3 degrees Celsius, though it could potentially occur as early as 4.5 °C or as late as 8.7 °C. Relative to today's climate, an ice-free winter would add 0.6 degrees, with a regional warming between 0.6 and 1.2 degrees.[50][51]
Amplified Arctic warming
[edit]Arctic amplification and its acceleration is strongly tied to declining Arctic sea ice: modelling studies show that strong Arctic amplification only occurs during the months when significant sea ice loss occurs, and that it largely disappears when the simulated ice cover is held fixed.[52] Conversely, the high stability of ice cover in Antarctica, where the thickness of the East Antarctic ice sheet allows it to rise nearly 4 km (2.5 mi) above the sea level, means that this continent has not experienced any net warming over the past seven decades:[53] ice loss in the Antarctic and its contribution to sea level rise is instead driven entirely by the warming of the Southern Ocean, which had absorbed 35–43% of the total heat taken up by all oceans between 1970 and 2017.[54]
Impacts on extreme weather
[edit]
Barents Sea ice
[edit]Barents Sea is the fastest-warming part of the Arctic, and some assessments now treat Barents sea ice as a separate tipping point from the rest of the Arctic sea ice, suggesting that it could permanently disappear once the global warming exceeds 1.5 degrees.[51] This rapid warming also makes it easier to detect any potential connections between the state of sea ice and weather conditions elsewhere than in any other area. The first study proposing a connection between floating ice decline in the Barents Sea and the neighbouring Kara Sea and more intense winters in Europe was published in 2010,[61] and there has been extensive research into this subject since then. For instance, a 2019 paper holds BKS ice decline responsible for 44% of the 1995–2014 central Eurasian cooling trend, far more than indicated by the models,[62] while another study from that year suggests that the decline in BKS ice reduces snow cover in the North Eurasia but increases it in central Europe.[63] There are also potential links to summer precipitation:[64] a connection has been proposed between the reduced BKS ice extent in November–December and greater June rainfall over South China.[65] One paper even identified a connection between Kara Sea ice extent and the ice cover of Lake Qinghai on the Tibetan Plateau.[66]
However, BKS ice research is often subject to the same uncertainty as the broader research into Arctic amplification/whole-Arctic sea ice loss and the jet stream, and is often challenged by the same data.[67] Nevertheless, the most recent research still finds connections which are statistically robust,[68] yet non-linear in nature: two separate studies published in 2021 indicate that while autumn BKS ice loss results in cooler Eurasian winters, ice loss during winter makes Eurasian winters warmer:[69] as BKS ice loss accelerates, the risk of more severe Eurasian winter extremes diminishes while heatwave risk in the spring and summer is magnified.[67][70]
Other possible impacts on weather
[edit]In 2019, it was proposed that the reduced sea ice around Greenland in autumn affects snow cover during the Eurasian winter, and this intensifies Korean summer monsoon, and indirectly affects the Indian summer monsoon.[71]
2021 research suggested that autumn ice loss in the East Siberian Sea, Chukchi Sea and Beaufort Sea can affect spring Eurasian temperature. Autumn sea ice decline of one standard deviation in that region would reduce mean spring temperature over central Russia by nearly 0.8 °C, while increasing the probability of cold anomalies by nearly a third.[72]
Atmospheric chemistry
[edit]A 2015 study concluded that Arctic sea ice decline accelerates methane emissions from the Arctic tundra, with the emissions for 2005-2010 being around 1.7 million tonnes higher than they would have been with the sea ice at 1981–1990 levels.[73] One of the researchers noted, "The expectation is that with further sea ice decline, temperatures in the Arctic will continue to rise, and so will methane emissions from northern wetlands."[74]
Cracks in Arctic sea ice expose the seawater to the air, causing mercury in the air to be absorbed into the water. This absorption leads to more mercury, a toxin, entering the food chain where it can negatively affect fish and the animals and people who consume them.[75][76] Mercury is part of Earth's atmosphere due to natural causes (see mercury cycle) and due to human emissions.[77][78]
Shipping
[edit]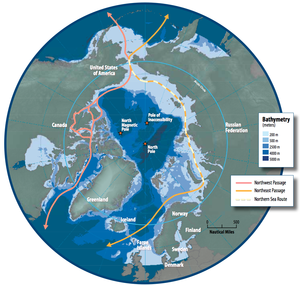
Economic implications of ice-free summers and the decline in Arctic ice volumes include a greater number of journeys across the Arctic Ocean Shipping lanes during the year. This number has grown from 0 in 1979 to 400–500 along the Bering strait and >40 along the Northern Sea Route in 2013.[79] Traffic through the Arctic Ocean is likely to increase further.[80][81] An early study by James Hansen and colleagues suggested in 1981 that a warming of 5 to 10 °C, which they expected as the range of Arctic temperature change corresponding to doubled CO2 concentrations, could open the Northwest Passage.[82] A 2016 study concludes that Arctic warming and sea ice decline will lead to "remarkable shifts in trade flows between Asia and Europe, diversion of trade within Europe, heavy shipping traffic in the Arctic and a substantial drop in Suez traffic. Projected shifts in trade also imply substantial pressure on an already threatened Arctic ecosystem."[83]
In August 2017, the first ship traversed the Northern Sea Route without the use of ice-breakers.[84] Also in 2017, the Finnish icebreaker MSV Nordica set a record for the earliest crossing of the Northwest Passage.[85] According to the New York Times, this forebodes more shipping through the Arctic, as the sea ice melts and makes shipping easier.[84] A 2016 report by the Copenhagen Business School found that large-scale trans-Arctic shipping will become economically viable by 2040.[86][84]
Impacts on wildlife
[edit]The decline of Arctic sea ice will provide humans with access to previously remote coastal zones. As a result, this will lead to an undesirable effect on terrestrial ecosystems and put marine species at risk.[87]
Sea ice decline has been linked to boreal forest decline in North America and is assumed to culminate with an intensifying wildfire regime in this region.[88] The annual net primary production of the Eastern Bering Sea was enhanced by 40–50% through phytoplankton blooms during warm years of early sea ice retreat.[89]
Polar bears are turning to alternative food sources because Arctic sea ice melts earlier and freezes later each year. As a result, they have less time to hunt their historically preferred prey of seal pups, and must spend more time on land and hunt other animals.[90] As a result, the diet is less nutritional, which leads to reduced body size and reproduction, thus indicating population decline in polar bears.[91] The Arctic refuge is where polar bears main habitat is to den and the melting arctic sea ice is causing a loss of species. There are only about 900 bears in the Arctic refuge national conservation area.[92]
As arctic ice decays, microorganisms produce substances with various effects on melting and stability. Certain types of bacteria in rotten ice pores produce polymer-like substances, which may influence the physical properties of the ice. A team from the University of Washington studying this phenomenon hypothesizes that the polymers may provide a stabilizing effect to the ice.[93] However, other scientists have found algae and other microorganisms help create a substance, cryoconite, or create other pigments that increase rotting and increase the growth of the microorganisms.[94][95]
See also
[edit]References
[edit]- ^ Huang, Yiyi; Dong, Xiquan; Bailey, David A.; Holland, Marika M.; Xi, Baike; DuVivier, Alice K.; Kay, Jennifer E.; Landrum, Laura L.; Deng, Yi (2019-06-19). "Thicker Clouds and Accelerated Arctic Sea Ice Decline: The Atmosphere-Sea Ice Interactions in Spring". Geophysical Research Letters. 46 (12): 6980–6989. Bibcode:2019GeoRL..46.6980H. doi:10.1029/2019gl082791. hdl:10150/634665. ISSN 0094-8276. S2CID 189968828.
- ^ Senftleben, Daniel; Lauer, Axel; Karpechko, Alexey (2020-02-15). "Constraining Uncertainties in CMIP5 Projections of September Arctic Sea Ice Extent with Observations". Journal of Climate. 33 (4): 1487–1503. Bibcode:2020JCli...33.1487S. doi:10.1175/jcli-d-19-0075.1. ISSN 0894-8755. S2CID 210273007.
- ^ Yadav, Juhi; Kumar, Avinash; Mohan, Rahul (2020-05-21). "Dramatic decline of Arctic sea ice linked to global warming". Natural Hazards. 103 (2): 2617–2621. Bibcode:2020NatHa.103.2617Y. doi:10.1007/s11069-020-04064-y. ISSN 0921-030X. S2CID 218762126.
- ^ "Ice in the Arctic is melting even faster than scientists expected, study finds". NPR.org. Retrieved 2022-07-10.
- ^ Fisher, David; Zheng, James; Burgess, David; Zdanowicz, Christian; Kinnard, Christophe; Sharp, Martin; Bourgeois, Jocelyne (March 2012). "Recent melt rates of Canadian arctic ice caps are the highest in four millennia". Global and Planetary Change. 84: 3–7. Bibcode:2012GPC....84....3F. doi:10.1016/j.gloplacha.2011.06.005.
- ^ J. C. Stroeve; T. Markus; L. Boisvert; J. Miller; A. Barrett (2014). "Changes in Arctic melt season and implications for sea ice loss". Geophysical Research Letters. 41 (4): 1216–1225. Bibcode:2014GeoRL..41.1216S. doi:10.1002/2013GL058951. S2CID 131673760.
- ^ a b c Fox-Kemper, B., H.T. Hewitt, C. Xiao, G. Aðalgeirsdóttir, S.S. Drijfhout, T.L. Edwards, N.R. Golledge, M. Hemer, R.E. Kopp, G. Krinner, A. Mix, D. Notz, S. Nowicki, I.S. Nurhati, L. Ruiz, J.-B. Sallée, A.B.A. Slangen, and Y. Yu, 2021: Chapter 9: Ocean, Cryosphere and Sea Level Change. In Climate Change 2021: The Physical Science Basis. Contribution of Working Group I to the Sixth Assessment Report of the Intergovernmental Panel on Climate Change [Masson-Delmotte, V., P. Zhai, A. Pirani, S.L. Connors, C. Péan, S. Berger, N. Caud, Y. Chen, L. Goldfarb, M.I. Gomis, M. Huang, K. Leitzell, E. Lonnoy, J.B.R. Matthews, T.K. Maycock, T. Waterfield, O. Yelekçi, R. Yu, and B. Zhou (eds.)]. Cambridge University Press, Cambridge, United Kingdom and New York, NY, USA, pp. 1211–1362, doi:10.1017/9781009157896.011.
- ^ "Arctic summer sea ice second lowest on record: US researchers". phys.org. 21 September 2020.
- ^ Slater, T. S.; Lawrence, I. S.; Otosaka, I. N.; Shepherd, A.; Gourmelen, N.; Jakob, L.; Tepes, P.; Gilbert, L.; Nienow, P. (25 January 2021). "Review article: Earth's ice imbalance". The Cryosphere. 15 (1): 233–246. Bibcode:2021TCry...15..233S. doi:10.5194/tc-15-233-2021. hdl:20.500.11820/df343a4d-6b66-4eae-ac3f-f5a35bdeef04.
- ^ Francis, Jennifer A.; Vavrus, Stephen J. (2012-03-28). "Evidence linking Arctic amplification to extreme weather in mid-latitudes". Geophysical Research Letters. 39 (6). Bibcode:2012GeoRL..39.6801F. doi:10.1029/2012GL051000. ISSN 0094-8276.
- ^ Meier, W. N.; Stroeve, J. (April 11, 2022). "An Updated Assessment of the Changing Arctic Sea Ice Cover". Oceanography. 35 (3–4): 10–19. doi:10.5670/oceanog.2022.114.
- ^ Goldstone, H. (September 18, 2023). "Natural atmospheric cycle has been stalling the loss of Arctic sea ice". Retrieved December 21, 2023.
- ^ Polyakov, Igor V.; Ingvaldsen, Randi B.; Pnyushkov, Andrey V.; Bhatt, Uma S.; Francis, Jennifer A.; Janout, Markus; Kwok, Ronald; Skagseth, Øystein (31 August 2023). "Fluctuating Atlantic inflows modulate Arctic atlantification". Science. 381 (6661): 972–979. Bibcode:2023Sci...381..972P. doi:10.1126/science.adh5158. hdl:11250/3104367. ISSN 0036-8075. PMID 37651524. S2CID 261395802.
- ^ NSIDC. "Quick Facts on Arctic Sea Ice". Retrieved 15 May 2015.
- ^ Stroeve, J.; Holland, M. M.; Meier, W.; Scambos, T.; Serreze, M. (2007). "Arctic sea ice decline: Faster than forecast". Geophysical Research Letters. 34 (9): L09501. Bibcode:2007GeoRL..34.9501S. doi:10.1029/2007GL029703.
- ^ Jennifer E. Kay; Marika M. Holland; Alexandra Jahn (August 22, 2011). "Inter-annual to multi-decadal Arctic sea ice extent trends in a warming world". Geophysical Research Letters. 38 (15): L15708. Bibcode:2011GeoRL..3815708K. doi:10.1029/2011GL048008. S2CID 55668392.
- ^ Julienne C. Stroeve; Vladimir Kattsov; Andrew Barrett; Mark Serreze; Tatiana Pavlova; Marika Holland; Walter N. Meier (2012). "Trends in Arctic sea ice extent from CMIP5, CMIP3, and observations". Geophysical Research Letters. 39 (16): L16502. Bibcode:2012GeoRL..3916502S. doi:10.1029/2012GL052676. S2CID 55953929.
- ^ "Daily Updated Time series of Arctic sea ice area and extent derived from SSMI data provided by NERSC". Archived from the original on 10 September 2013. Retrieved 14 September 2013.
- ^ Watch 27 years of 'old' Arctic ice melt away in seconds The Guardian 21 February 2014
- ^ Hannah Hickey (July 29, 2014). "Huge waves measured for first time in Arctic Ocean". University of Washington.
- ^ "Absurd January Warmth in Arctic Brings Record-Low Sea Ice Extent". Wunderground. 2016.
- ^ Simon Wang, S.-Y.; Lin, Yen-Heng; Lee, Ming-Ying; Yoon, Jin-Ho; Meyer, Jonathan D. D.; Rasch, Philip J. (23 March 2017). "Accelerated increase in the Arctic tropospheric warming events surpassing stratospheric warming events during winter". Geophysical Research Letters. 44 (8): 3806–3815. Bibcode:2017GeoRL..44.3806W. doi:10.1002/2017GL073012. S2CID 53649177.
- ^ "Charctic Interactive Sea Ice Graph | Arctic Sea Ice News and Analysis".
- ^ Kwok, R. (2018-10-12). "Arctic sea ice thickness, volume, and multiyear ice coverage: losses and coupled variability (1958–2018)". Environmental Research Letters. 13 (10): 105005. doi:10.1088/1748-9326/aae3ec. ISSN 1748-9326.
- ^ Johannessen, O. M., M. Miles, and E. Bjørgo, 1995: The Arctic's shrinking sea ice. Nature, 376, 126–127.
- ^ Cavalieri, D. J., P. Gloersen, C. L. Parkinson, J. C. Comiso, and H. J. Zwally, 1997: Observed hemispheric asymmetry in global sea ice changes. Science, 278, 1104–1106.
- ^ "Climate Change 2013: The Physical Science Basis" (PDF). ipcc. Intergovernmental Panel on Climate Change. p. 324. Archived (PDF) from the original on 2014-11-11. Retrieved 16 June 2015.
- ^ Marques, Luiz (2020). "Climate Feedbacks and Tipping Points". Capitalism and Environmental Collapse. Springer Publishing. p. 210. doi:10.1007/978-3-030-47527-7_8. ISBN 978-3-030-47529-1. S2CID 226715587.
- ^ Hu, Yongyun; Horton, Radley M.; Song, Mirong; Liu, Jiping (2013-07-10). "Reducing spread in climate model projections of a September ice-free Arctic". Proceedings of the National Academy of Sciences. 110 (31): 12571–12576. Bibcode:2013PNAS..11012571L. doi:10.1073/pnas.1219716110. ISSN 0027-8424. PMC 3732917. PMID 23858431.
- ^ "Study predicts an ice-free Arctic by the 2050s". Phys.org. August 8, 2013.
- ^ Hu, Yongyun; Horton, Radley M.; Song, Mirong; Liu, Jiping (2013-07-30). "Reducing spread in climate model projections of a September ice-free Arctic". Proceedings of the National Academy of Sciences. 110 (31): 12571–12576. Bibcode:2013PNAS..11012571L. doi:10.1073/pnas.1219716110. ISSN 0027-8424. PMC 3732917. PMID 23858431.
- ^ a b IPCC AR5 WG1 (2013). "The Physical Science Basis" (PDF).
{{cite journal}}: Cite journal requires|journal=(help)CS1 maint: numeric names: authors list (link) - ^ Overland, James E.; Wang, Muyin (21 May 2013). "When will the summer Arctic be nearly sea ice free?". Geophysical Research Letters. 40 (10): 2097–2101. Bibcode:2013GeoRL..40.2097O. doi:10.1002/grl.50316. S2CID 129474241.
- ^ "Arctic summers could be nearly ice free by 2050". Carbon Brief. 7 March 2013. Retrieved 15 October 2022.
- ^ Holland, M. M.; Bitz, C. M.; Tremblay, B. (2006). "Future abrupt reductions in the summer Arctic sea ice". Geophysical Research Letters. 33 (23): L23503. Bibcode:2006GeoRL..3323503H. CiteSeerX 10.1.1.650.1778. doi:10.1029/2006GL028024. S2CID 14187034.
- ^ Overland, James E.; Wang, Muyin (3 April 2009). "A sea ice free summer Arctic within 30 years?". Geophysical Research Letters. 36 (7). Bibcode:2009GeoRL..36.7502W. doi:10.1029/2009GL037820. S2CID 131064532.
- ^ Overland, James E.; Wang, Muyin (25 September 2012). "A sea ice free summer Arctic within 30 years: An update from CMIP5 models". Geophysical Research Letters. 39 (18). Bibcode:2012GeoRL..3918501W. doi:10.1029/2012GL052868. S2CID 9338828.
- ^ Boé, Julien; Hall, Alex; Qu, Xin (15 March 2009). "September sea-ice cover in the Arctic Ocean projected to vanish by 2100". Nature Geoscience. 2 (5): 341–343. Bibcode:2009NatGe...2..341B. doi:10.1038/ngeo467.
- ^ a b Stroeve, Julienne C.; Kattsov, Vladimir; Barrett, Andrew; Serreze, Mark; Pavlova, Tatiana; Holland, Marika; Meier, Walter N. (25 August 2012). "Trends in Arctic sea ice extent from CMIP5, CMIP3 and observations". Geophysical Research Letters. 39 (16). Bibcode:2012GeoRL..3916502S. doi:10.1029/2012GL052676. S2CID 55953929.
- ^ "Melting Ice Key Message Third National Climate Assessment". National Climate Assessment. Retrieved 25 June 2014.
- ^ "Ice-free Arctic summers could happen on earlier side of predictions: A new study in AGU's journal Geophysical Research Letters predicts the Arctic Ocean will be ice-free in summer by mid-century". ScienceDaily. Retrieved 2019-10-01.
- ^ Docquier, David; Koenigk, Torben (15 July 2021). "Observation-based selection of climate models projects Arctic ice-free summers around 2035". Communications Earth & Environment. 2 (1): 144. Bibcode:2021ComEE...2..144D. doi:10.1038/s43247-021-00214-7. S2CID 235826846.
- ^ Zhao, Jiazhen; He, Shengping; Wang, Huijun; Li, Fei (12 October 2022). "Constraining CMIP6 Projections of an Ice-Free Arctic Using a Weighting Scheme". Earth's Future. 10 (10). Bibcode:2022EaFut..1002708Z. doi:10.1029/2022EF002708. hdl:11250/3040157. ISSN 2328-4277.
- ^ "Sea ice properties". NSIDC.
- ^ Pistone, Kristina; Eisenman, Ian; Ramanathan, Veerabhadran (2019). "Radiative Heating of an Ice-Free Arctic Ocean". Geophysical Research Letters. 46 (13): 7474–7480. Bibcode:2019GeoRL..46.7474P. doi:10.1029/2019GL082914. ISSN 1944-8007. S2CID 197572148.
- ^ Arias, Paola A.; Bellouin, Nicolas; Coppola, Erika; Jones, Richard G.; et al. (2021). "Technical Summary" (PDF). IPCC AR6 WG1. p. 76.
- ^ Sledd, Anne; L'Ecuyer, Tristan S. (2 December 2021). "A Cloudier Picture of Ice-Albedo Feedback in CMIP6 Models". Frontiers in Earth Science. 9: 1067. Bibcode:2021FrEaS...9.1067S. doi:10.3389/feart.2021.769844.
- ^ Wunderling, Nico; Willeit, Matteo; Donges, Jonathan F.; Winkelmann, Ricarda (27 October 2020). "Global warming due to loss of large ice masses and Arctic summer sea ice". Nature Communications. 10 (1): 5177. Bibcode:2020NatCo..11.5177W. doi:10.1038/s41467-020-18934-3. PMC 7591863. PMID 33110092.
- ^ Sigmond, Michael; Fyfe, John C.; Swart, Neil C. (2 April 2018). "Ice-free Arctic projections under the Paris Agreement". Nature Climate Change. 2 (5): 404–408. Bibcode:2018NatCC...8..404S. doi:10.1038/s41558-018-0124-y. S2CID 90444686.
- ^ Armstrong McKay, David; Abrams, Jesse; Winkelmann, Ricarda; Sakschewski, Boris; Loriani, Sina; Fetzer, Ingo; Cornell, Sarah; Rockström, Johan; Staal, Arie; Lenton, Timothy (9 September 2022). "Exceeding 1.5°C global warming could trigger multiple climate tipping points". Science. 377 (6611): eabn7950. doi:10.1126/science.abn7950. hdl:10871/131584. ISSN 0036-8075. PMID 36074831. S2CID 252161375.
- ^ a b Armstrong McKay, David (9 September 2022). "Exceeding 1.5°C global warming could trigger multiple climate tipping points – paper explainer". climatetippingpoints.info. Retrieved 2 October 2022.
- ^ Dai, Aiguo; Luo, Dehai; Song, Mirong; Liu, Jiping (10 January 2019). "Arctic amplification is caused by sea-ice loss under increasing CO2". Nature Communications. 10 (1): 121. Bibcode:2019NatCo..10..121D. doi:10.1038/s41467-018-07954-9. PMC 6328634. PMID 30631051.
- ^ Singh, Hansi A.; Polvani, Lorenzo M. (10 January 2020). "Low Antarctic continental climate sensitivity due to high ice sheet orography". npj Climate and Atmospheric Science. 3 (1): 39. Bibcode:2020npCAS...3...39S. doi:10.1038/s41612-020-00143-w. S2CID 222179485.
- ^ Auger, Matthis; Morrow, Rosemary; Kestenare, Elodie; Nordling, Kalle; Sallée, Jean-Baptiste; Cowley, Rebecca (21 January 2021). "Southern Ocean in-situ temperature trends over 25 years emerge from interannual variability". Nature Communications. 10 (1): 514. Bibcode:2021NatCo..12..514A. doi:10.1038/s41467-020-20781-1. PMC 7819991. PMID 33479205.
- ^ Archer, Cristina L.; Caldeira, Ken (18 April 2008). "Historical trends in the jet streams". Geophysical Research Letters. 35 (8). Bibcode:2008GeoRL..35.8803A. doi:10.1029/2008GL033614. S2CID 59377392.
- ^ "Jet stream found to be permanently drifting north". Associated Press. 2008-04-18. Archived from the original on 17 August 2016. Retrieved 7 October 2022.
- ^ Rantanen, Mika; Karpechko, Alexey Yu; Lipponen, Antti; Nordling, Kalle; Hyvärinen, Otto; Ruosteenoja, Kimmo; Vihma, Timo; Laaksonen, Ari (11 August 2022). "The Arctic has warmed nearly four times faster than the globe since 1979". Communications Earth & Environment. 3 (1): 168. Bibcode:2022ComEE...3..168R. doi:10.1038/s43247-022-00498-3. hdl:11250/3115996. ISSN 2662-4435. S2CID 251498876.
- ^ "The Arctic is warming four times faster than the rest of the world". Science Magazine. 2021-12-14. Archived from the original on 8 November 2023. Retrieved 6 October 2022.
- ^ Isaksen, Ketil; Nordli, Øyvind; et al. (15 June 2022). "Exceptional warming over the Barents area". Scientific Reports. 12 (1): 9371. Bibcode:2022NatSR..12.9371I. doi:10.1038/s41598-022-13568-5. PMC 9200822. PMID 35705593.
- ^ Damian Carrington (2022-06-15). "New data reveals extraordinary global heating in the Arctic". The Guardian. Archived from the original on 1 October 2023. Retrieved 7 October 2022.
- ^ Petoukhov, Vladimir; Semenov, Vladimir A. (2010). "A link between reduced Barents-Kara sea ice and cold winter extremes over northern continents" (PDF). Journal of Geophysical Research. 115 (D21): D21111. Bibcode:2010JGRD..11521111P. doi:10.1029/2009JD013568.
- ^ Mori, Masato; Kosaka, Yu; Watanabe, Masahiro; Nakamura, Hisashi; Kimoto, Masahide (14 January 2019). "A reconciled estimate of the influence of Arctic sea-ice loss on recent Eurasian cooling". Nature Climate Change. 9 (2): 123–129. Bibcode:2019NatCC...9..123M. doi:10.1038/s41558-018-0379-3. S2CID 92214293.
- ^ Xu, Bei; Chen, Haishan; Gao, Chujie; Zhou, Botao; Sun, Shanlei; Zhu, Siguang (1 July 2019). "Regional response of winter snow cover over the Northern Eurasia to late autumn Arctic sea ice and associated mechanism". Atmospheric Research. 222: 100–113. Bibcode:2019AtmRe.222..100X. doi:10.1016/j.atmosres.2019.02.010. S2CID 126675127.
- ^ He, Shengping; Gao, Yongqi; Furevik, Tore; Wang, Huijun; Li, Fei (16 December 2017). "Teleconnection between sea ice in the Barents Sea in June and the Silk Road, Pacific–Japan and East Asian rainfall patterns in August". Advances in Atmospheric Sciences. 35: 52–64. doi:10.1007/s00376-017-7029-y. S2CID 125312203.
- ^ Yang, Huidi; Rao, Jian; Chen, Haishan (25 April 2022). "Possible Lagged Impact of the Arctic Sea Ice in Barents–Kara Seas on June Precipitation in Eastern China". Frontiers in Earth Science. 10: 886192. Bibcode:2022FrEaS..10.6192Y. doi:10.3389/feart.2022.886192.
- ^ Liu, Yong; Chen, Huopo; Wang, Huijun; Sun, Jianqi; Li, Hua; Qiu, Yubao (1 May 2019). "Modulation of the Kara Sea Ice Variation on the Ice Freeze-Up Time in Lake Qinghai". Journal of Climate. 32 (9): 2553–2568. Bibcode:2019JCli...32.2553L. doi:10.1175/JCLI-D-18-0636.1. S2CID 133858619.
- ^ a b Song, Mirong; Wang, Zhao-Yin; Zhu, Zhu; Liu, Ji-Ping (August 2021). "Nonlinear changes in cold spell and heat wave arising from Arctic sea-ice loss". Advances in Climate Change Research. 12 (4): 553–562. Bibcode:2021ACCR...12..553S. doi:10.1016/j.accre.2021.08.003. S2CID 238716298.
- ^ Dai, Aiguo; Deng, Jiechun (4 January 2022). "Recent Eurasian winter cooling partly caused by internal multidecadal variability amplified by Arctic sea ice-air interactions". Climate Dynamics. 58 (11–12): 3261–3277. Bibcode:2022ClDy...58.3261D. doi:10.1007/s00382-021-06095-y. S2CID 245672460.
- ^ Zhang, Ruonan; Screen, James A. (16 June 2021). "Diverse Eurasian Winter Temperature Responses to Barents-Kara Sea Ice Anomalies of Different Magnitudes and Seasonality". Geophysical Research Letters. 48 (13). Bibcode:2021GeoRL..4892726Z. doi:10.1029/2021GL092726. S2CID 236235248.
- ^ Sun, Jianqi; Liu, Sichang; Cohen, Judah; Yu, Shui (2 August 2022). "Influence and prediction value of Arctic sea ice for spring Eurasian extreme heat events". Communications Earth & Environment. 3 (1): 172. Bibcode:2022ComEE...3..172S. doi:10.1038/s43247-022-00503-9. S2CID 251230011.
- ^ Kim, In-Won; Prabhu, Amita; Oh, Jaiho; Kripalani, Ramesh H. (9 August 2019). "Combined impact of Greenland sea ice, Eurasian snow, and El Niño–Southern Oscillation on Indian and Korean summer monsoons". International Journal of Climatology. 40 (3): 1375–1395. doi:10.1002/joc.6275. S2CID 202183769.
- ^ Ding, Shuoyi; Wu, Bingyi (11 June 2021). "Linkage between autumn sea ice loss and ensuing spring Eurasian temperature". Climate Dynamics. 57 (9–10): 2793–2810. Bibcode:2021ClDy...57.2793D. doi:10.1007/s00382-021-05839-0. S2CID 235407468.
- ^ Parmentier, Frans-Jan W.; Zhang, Wenxin; Mi, Yanjiao; Zhu, Xudong; van Huissteden, Jacobus; J. Hayes, Daniel; Zhuang, Qianlai; Christensen, Torben R.; McGuire, A. David (25 July 2015). "Rising methane emissions from northern wetlands associated with sea ice decline". Geophysical Research Letters. 42 (17): 7214–7222. Bibcode:2015GeoRL..42.7214P. doi:10.1002/2015GL065013. PMC 5014133. PMID 27667870.
- ^ "Melting Arctic sea ice accelerates methane emissions". ScienceDaily. 2015. Archived from the original on 2019-06-08. Retrieved 2018-03-09.
- ^ Christopher W. Moore; Daniel Obrist; Alexandra Steffen; Ralf M. Staebler; Thomas A. Douglas; Andreas Richter; Son V. Nghiem (January 2014). "Convective forcing of mercury and ozone in the Arctic boundary layer induced by leads in sea ice". Nature Letters. 506 (7486): 81–84. Bibcode:2014Natur.506...81M. doi:10.1038/nature12924. PMID 24429521. S2CID 1431542.
- ^ Rasmussen, Carol (15 January 2014). "Cracked sea ice stirs up Arctic mercury concern". ScienceDaily. NASA/Jet Propulsion Laboratory.
- ^ "Human emissions increased mercury in the atmosphere sevenfold". seas.harvard.edu. November 1, 2023. Retrieved 2024-08-23.
- ^ Pirrone, N.; Cinnirella, S.; Feng, X.; Finkelman, R. B.; Friedli, H. R.; Leaner, J.; Mason, R.; Mukherjee, A. B.; Stracher, G. B.; Streets, D. G.; Telmer, K. (2010-07-02). "Global mercury emissions to the atmosphere from anthropogenic and natural sources". Atmospheric Chemistry and Physics. 10 (13): 5951–5964. Bibcode:2010ACP....10.5951P. doi:10.5194/acp-10-5951-2010. ISSN 1680-7324.
- ^ Society, National Geographic. "Interactive Map: The Changing Arctic". National Geographic. Retrieved 2016-11-29.
- ^ Fountain, Henry (2017-07-23). "With More Ships in the Arctic, Fears of Disaster Rise". The New York Times. ISSN 0362-4331. Retrieved 2017-07-24.
- ^ McGrath, Matt (2017-08-24). "First tanker crosses northern sea route without ice breaker". BBC News. Retrieved 2017-08-24.
- ^ Hansen, J.; et al. (1981). "Climate impact of increasing atmospheric carbon dioxide". Science. 231 (4511): 957–966. Bibcode:1981Sci...213..957H. doi:10.1126/science.213.4511.957. PMID 17789014. S2CID 20971423.
- ^ Bekkers, Eddy; Francois, Joseph F.; Rojas-Romagosa, Hugo (2016-12-01). "Melting Ice Caps and the Economic Impact of Opening the Northern Sea Route" (PDF). The Economic Journal. 128 (610): 1095–1127. doi:10.1111/ecoj.12460. ISSN 1468-0297. S2CID 55162828.
- ^ a b c Goldman, Russell (2017-08-25). "Russian Tanker Completes Arctic Passage Without Aid of Icebreakers". The New York Times. ISSN 0362-4331. Retrieved 2017-08-26.
- ^ "Ship sets record for earliest crossing of notorious Northwest Passage through Arctic". The Independent. July 30, 2017.
- ^ "Arctic shipping – Commercial opportunities and challenges" (PDF).
- ^ Walker, Donald A.; Stirling, Ian; Kutz, Susan J.; Kerby, Jeffrey; Hebblewhite, Mark; Fulton, Tara L.; Brodie, Jedediah F.; Bitz, Cecilia M.; Bhatt, Uma S. (2013-08-02). "Ecological Consequences of Sea-Ice Decline". Science. 341 (6145): 519–524. Bibcode:2013Sci...341..519P. doi:10.1126/science.1235225. ISSN 0036-8075. PMID 23908231. S2CID 206547835.
- ^ Martin P. Girardin; Xiao Jing Guo; Rogier De Jong; Christophe Kinnard; Pierre Bernier; Frédéric Raulier (December 2013). "Unusual forest growth decline in boreal North America covaries with the retreat of Arctic sea ice". Global Change Biology. 20 (3): 851–866. Bibcode:2014GCBio..20..851G. doi:10.1111/gcb.12400. PMID 24115302. S2CID 35621885.
- ^ Zachary W. Brown; Kevin R. Arrigo (January 2013). "Sea ice impacts on spring bloom dynamics and net primary production in the Eastern Bering Sea". Journal of Geophysical Research: Oceans. 118 (1): 43–62. Bibcode:2013JGRC..118...43B. doi:10.1029/2012JC008034.
- ^ Elizabeth Peacock; Mitchell K. Taylor; Jeffrey Laake; Ian Stirling (April 2013). "Population ecology of polar bears in Davis Strait, Canada and Greenland". The Journal of Wildlife Management. 77 (3): 463–476. Bibcode:2013JWMan..77..463P. doi:10.1002/jwmg.489.
- ^ Karyn D. Rode; Steven C. Amstrup; Eric V. Regehr (2010). "Reduced body size and cub recruitment in polar bears associated with sea ice decline". Ecological Applications. 20 (3): 768–782. Bibcode:2010EcoAp..20..768R. doi:10.1890/08-1036.1. PMID 20437962. S2CID 25352903.
- ^ "Protecting the Arctic National Wildlife Refuge".
- ^ "Extreme Summer Melt". Applied Physics Laboratory at the University of Washington. Archived from the original on 2021-10-09. Retrieved 2021-03-18.
- ^ Haas, Christian; Thomas, David N.; Bareiss, Jörg (2001). "Surface properties and processes of perennial Antarctic sea ice in summer". Journal of Glaciology. 47 (159): 613–625. Bibcode:2001JGlac..47..613H. doi:10.3189/172756501781831864. ISSN 0022-1430.
- ^ Pfeifer, Hazel (2021-01-20). "Microscopic life is melting Greenland's ice sheet". CNN. Archived from the original on 2020-12-15. Retrieved 2021-03-18.

